ES Futures Recap & Week Ahead · Aug 10–14, 2026
A four-day rally cracked Wednesday afternoon on no headline; Friday's payrolls miss put the week's high back in reach and closed there.

ES opened the week testing the top of a balance it had lived under for a month. It closed 260.50 points higher, with almost nothing of size left standing between Friday's settle and the air above it. A four-day rally cracked once, on Wednesday afternoon, on no headline anyone can point to. Friday's payrolls miss put the week's high back in reach and closed the week there instead of fading it.
ES settled Friday at 7779.75, up 260.50 points on the week, 3.46% above the prior Friday's 7519.25. The week traded a 277.50-point range, 7542.75 up to 7820.25, 3.69% of that prior settle. All profiles here are regular-session only, 09:30 to 16:15 ET; the overnight Globex session enters as inventory, positions accumulated outside regular hours, and as gap context. Times throughout are ET.
The week in profile
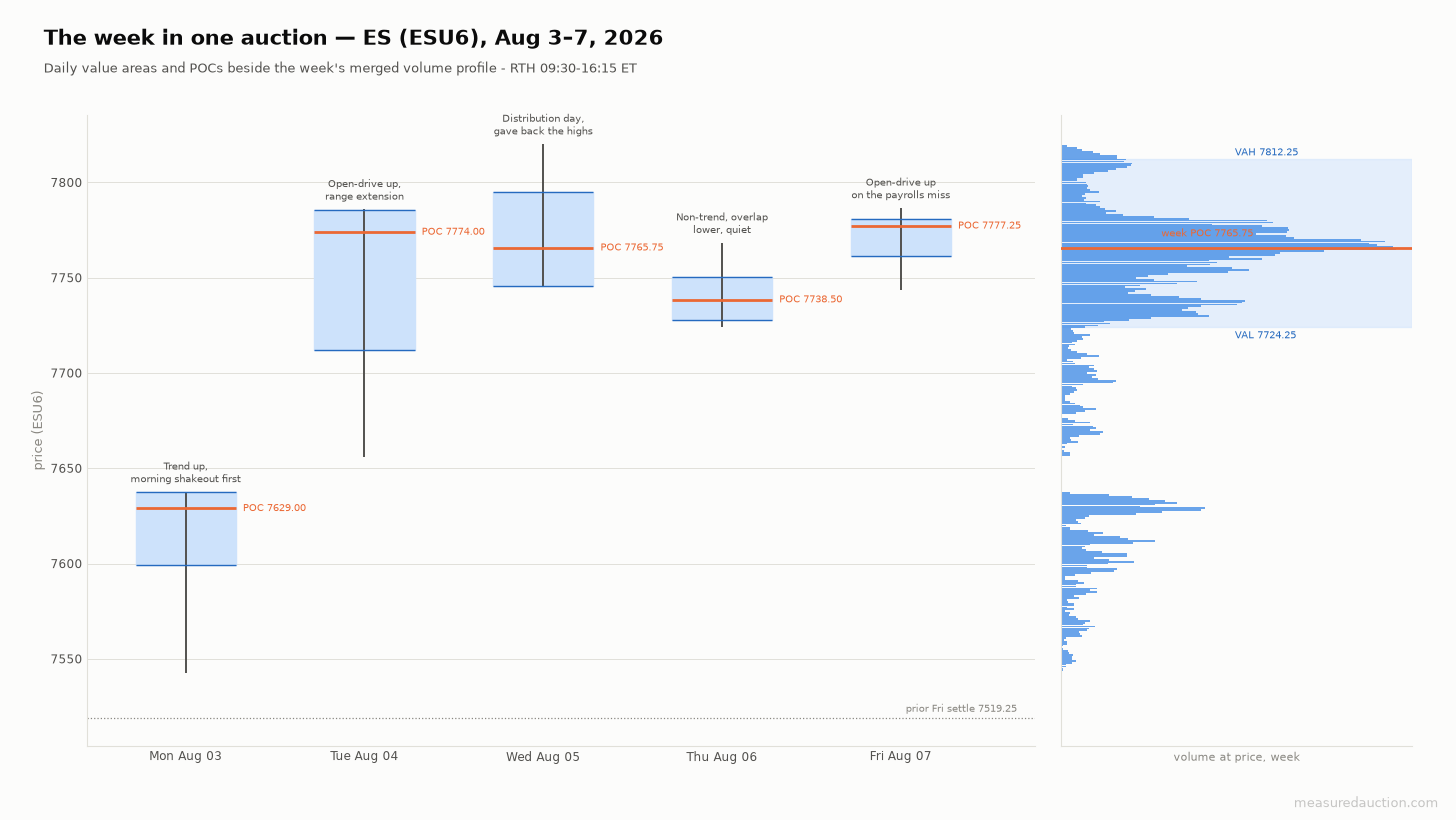
Five sessions on one scale. The week's own value settles at 7724.25 to 7812.25 with its point of control, the price with the most traded volume, at 7765.75. Every session's range sits above the prior Friday's settle.
Monday was still fighting the old balance. Sunday night and London traded 7550 to 7565, then eased to the session low, 7542.75, at 09:25. That low sat twenty-three and a half points above Friday's settle, still inside the range the market had held for weeks. Trump called off a planned strike on Iran ahead of Strait of Hormuz talks, and oil fell 5% [1][2]. Mega-cap earnings reactions were broadly positive: Meta up 6%, Amazon to a new market-cap high, Alphabet and Microsoft both up near 5% [1]. ES rallied through the session to settle 7628.25, 93.9% of the way up its range, on 104.6% of 20-day volume.
Tuesday was the breakout proper. Earnings beat-rate momentum continued, 87% of reports beating against 82% a year ago, with further Hormuz de-escalation reports and the 10-year yield down to 4.625% [3]. ES ran from Monday's 7628.25 settle to 7786.00 at 15:45, closed 7773.75, 90.6% of its range, and settled 7765.50 on 125.1% of 20-day volume, the heaviest session of the week. The session's regular-hours delta was negative 4,246 contracts despite the up close, a session that closed strong on aggressive selling underneath it.
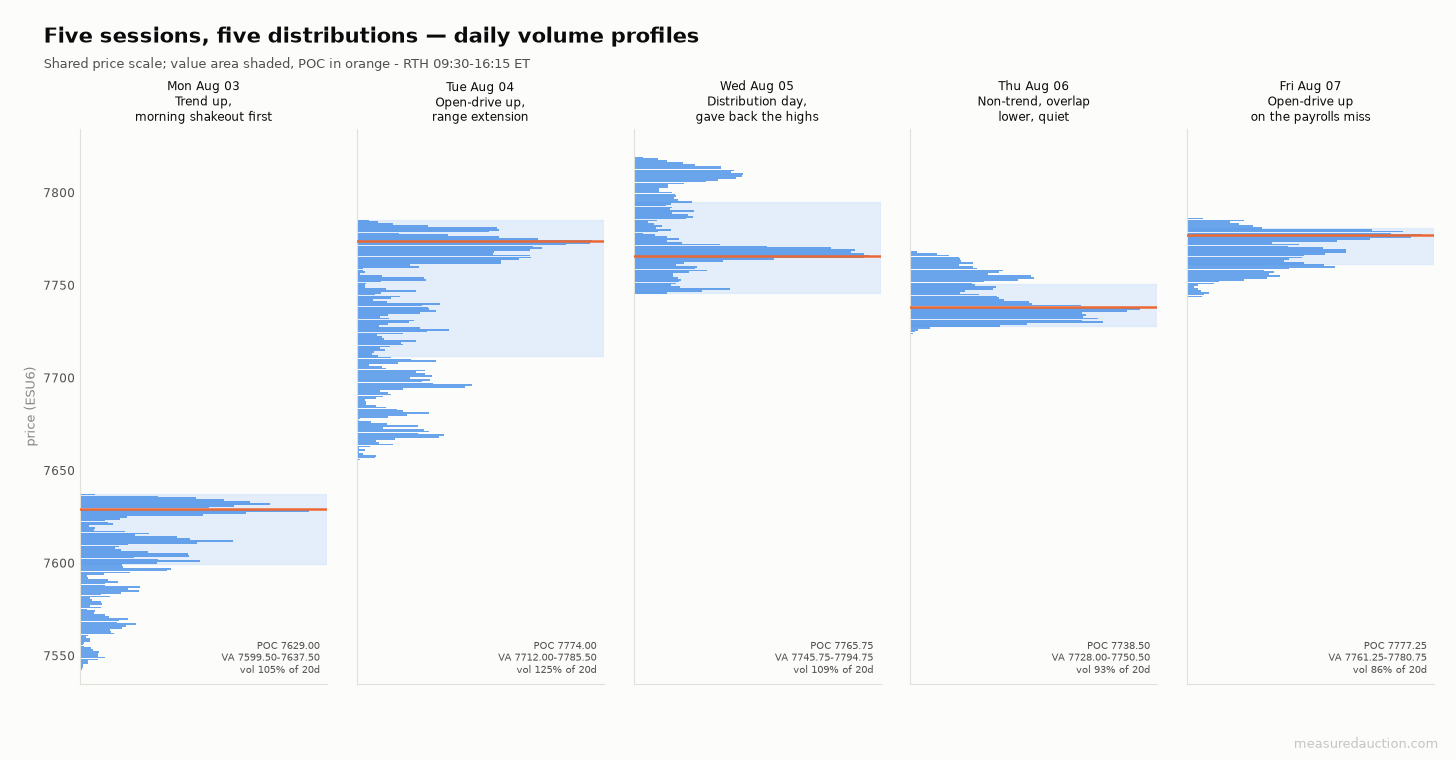
The shapes carry the argument. Monday and Tuesday build almost no overlap with the days before them. Wednesday gives part of it back. Thursday digests. Friday adds one more leg.
Wednesday printed the week's high and then took it back. The gap-up open extended the rally to a fresh record, the week high, 7820.25, printing at 09:35 to 09:40, 10.50 points into that open. Then breadth turned as an afternoon rotation out of AI and tech names set in. Decliners led advancers roughly nine to eight in the S&P and eleven to seven in the Nasdaq [4]. At 15:55 the session broke on 104,390 contracts in five minutes, ten to twenty times the volume in the bars around it, down to 7745.75. There is no headline timestamped to that minute. ES settled 7749.50, closing only 18.5% of the way up its range.
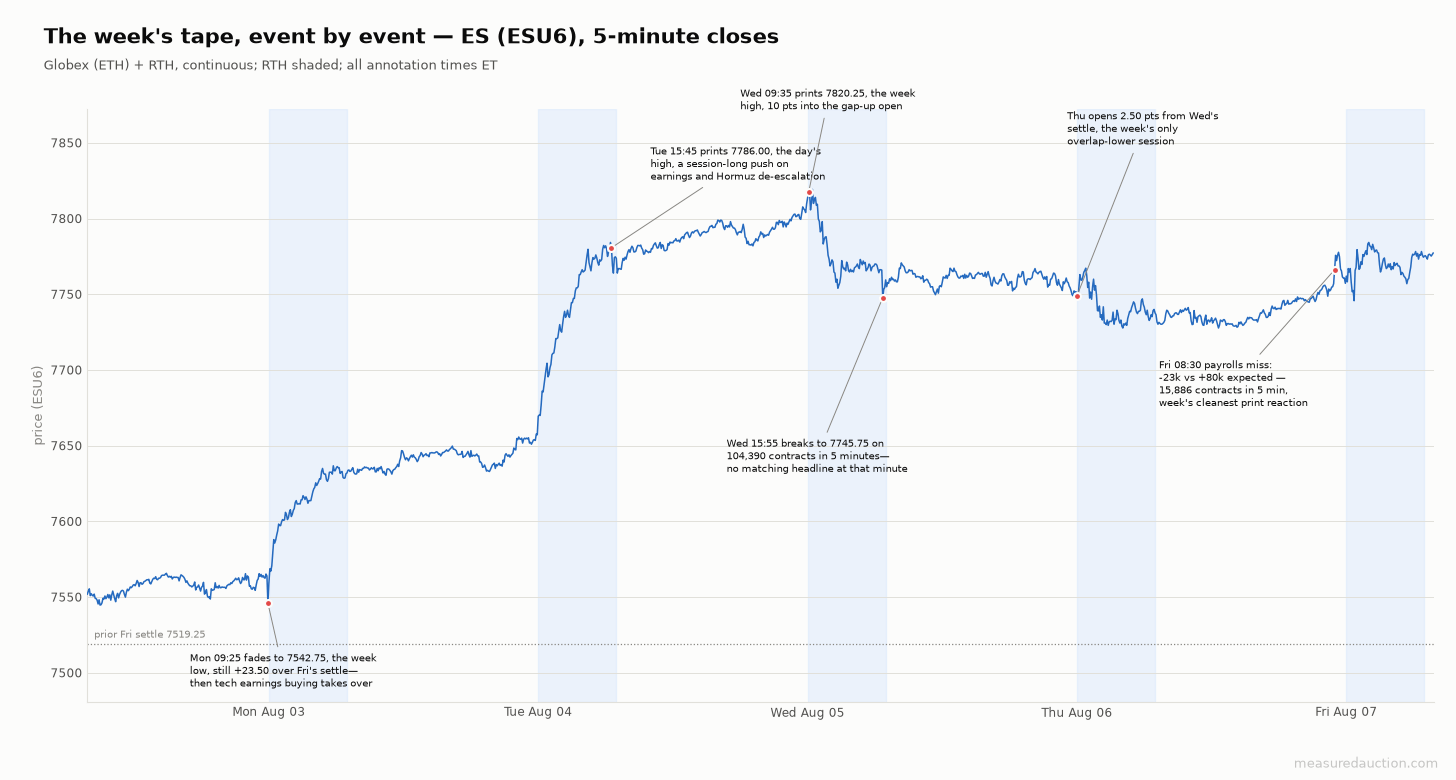
The whole week in one line. The session held near its high for six hours, then gave nearly all of it back in a single five-minute bracket at 15:55.
Thursday went quiet. Iran's parliament was reported reviewing legislation to restrict US and Israeli vessels in the Strait of Hormuz, and WTI rose 2.75% to $77.29. A run of software-earnings misses weighed on the tape while the market waited for Friday's jobs report [5]. ES drifted in a 28.25-point initial balance all session on 93.1% of 20-day volume. The open, 7752.00, sat only 2.50 points above Wednesday's settle, the smallest gap of the week, and the session settled 7734.75. It was the week's only session whose value migrated lower rather than higher, overlapping Wednesday's range instead of extending it.
Friday absorbed a payrolls miss and kept climbing. July nonfarm payrolls printed negative 23,000 against 80,000 expected, unemployment fell to 4.1%, and the prior two months were revised down a combined 100,000-plus [6][7]. The 08:30 five-minute bar traded 15,886 contracts, three to eight times the volume in the bars around it, as price jumped from 7756.50 to a 7774.50 high inside that bar. The move held into the open and extended through the session, which closed 7775.25, 73.4% of its range, and settled 7779.75, the week's high settle, on 85.5% of 20-day volume. The session's high, 7786.75, is flagged as a poor high, a rejection that did not resolve cleanly in a single bracket.
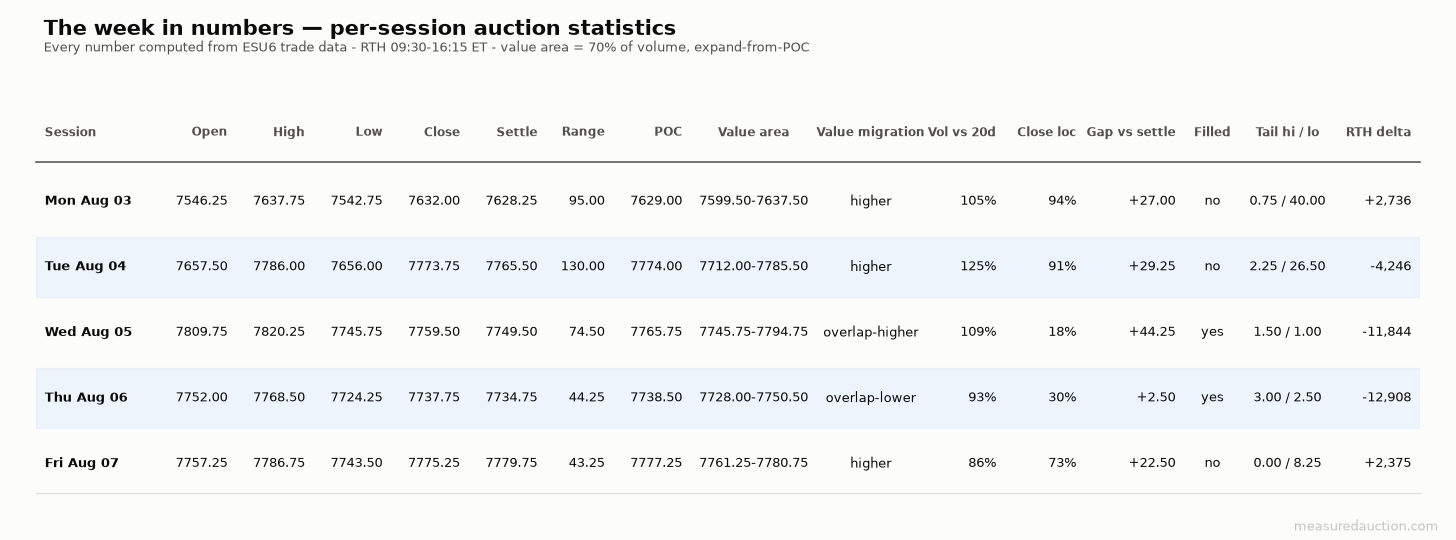
Every session's numbers. Tuesday and Wednesday carry the week's heaviest volume, and they point in opposite directions.
What broke, and what got repaired
An auction leaves work behind in three shapes. Excess is a tail of prices touched in only one half-hour bracket at an extreme; single prints are the same thing in the middle of a distribution. An unfilled gap is an open the session never traded back from. Each is a place the market moved through without doing business, and each tends to draw price back eventually.
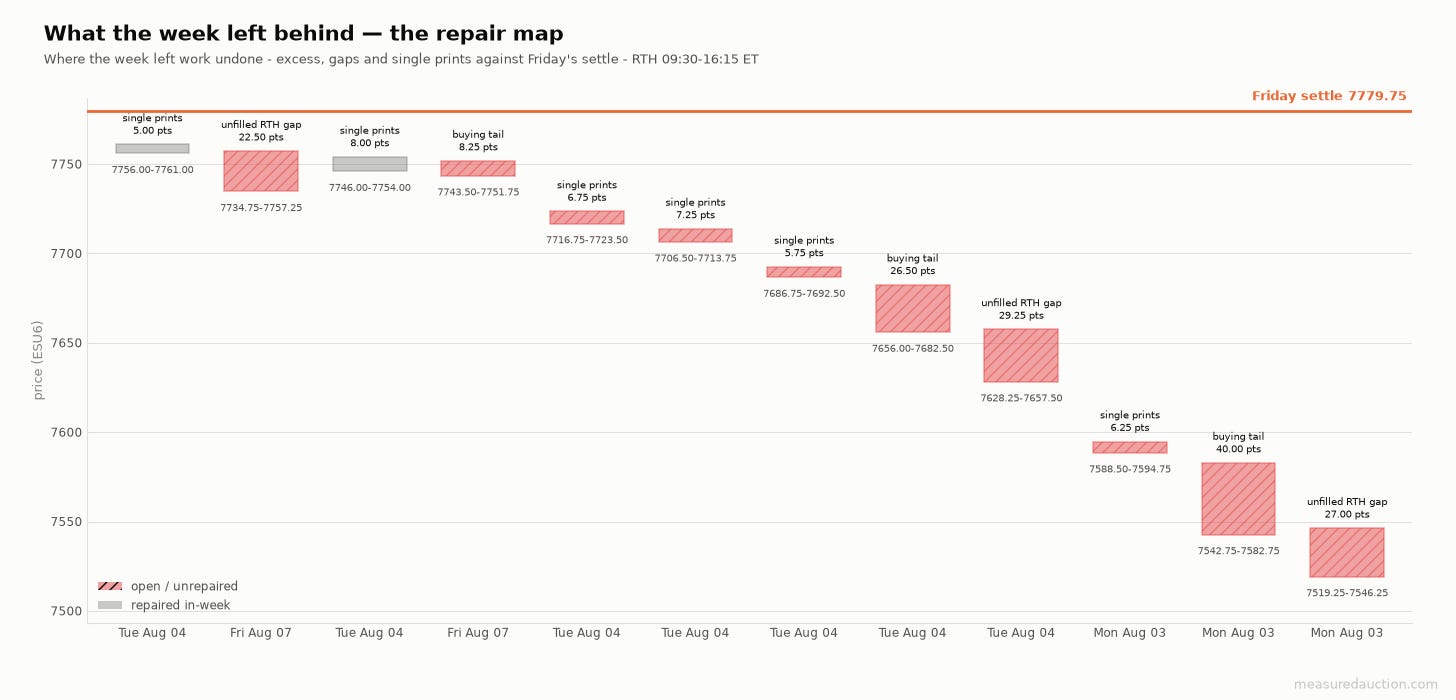
Twelve zones five points or wider. Every one of them sits below Friday's settle. Nothing of that size is left overhead.
That is the whole story of the week's structure. Above 7779.75 there is no unfinished business five points or wider. Below it there is a stack, most of it still open. Monday left a 27.00-point unfilled gap from 7519.25 to 7546.25 and a 40.00-point buying tail from 7542.75 to 7582.75. Tuesday added a 29.25-point unfilled gap from 7628.25 to 7657.50 and a 26.50-point buying tail from 7656.00 to 7682.50. Friday's own session left a fresh 22.50-point unfilled gap between Thursday's 7734.75 settle and Friday's 7757.25 open. None of that work threatens the week's direction by itself; it only marks where the market would have to trade to test it.
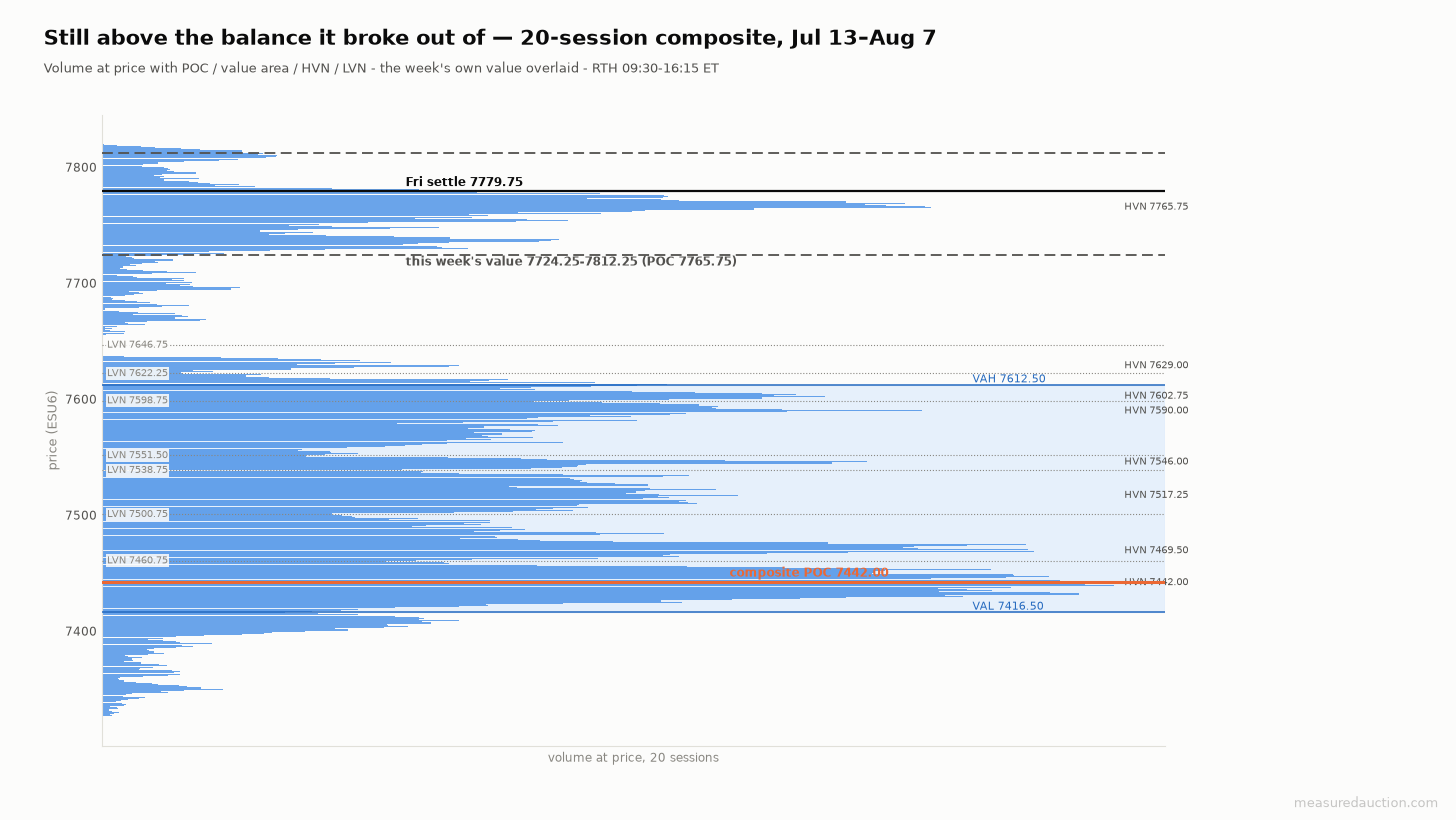
The wider frame. The 20-session value area tops out at 7612.50. The week's own value area, 7724.25 to 7812.25, does not overlap it at all.
That non-overlap is the clean way to read the balance the week broke. Monday and Tuesday's daily value areas showed effectively no overlap with the day before, negative 59.75 and negative 74.50 points respectively, the sharpest two-day disconnection since late June. The 20-session composite's point of control, 7442.00, and its value high, 7612.50, now sit well beneath the week's own value floor, 7724.25. The nearest structure with real volume behind it in that older distribution is thin. The low-volume shelves at 7622.25 and 7646.75 are prices the market passed through on the way up; it never built value there.
What volatility did
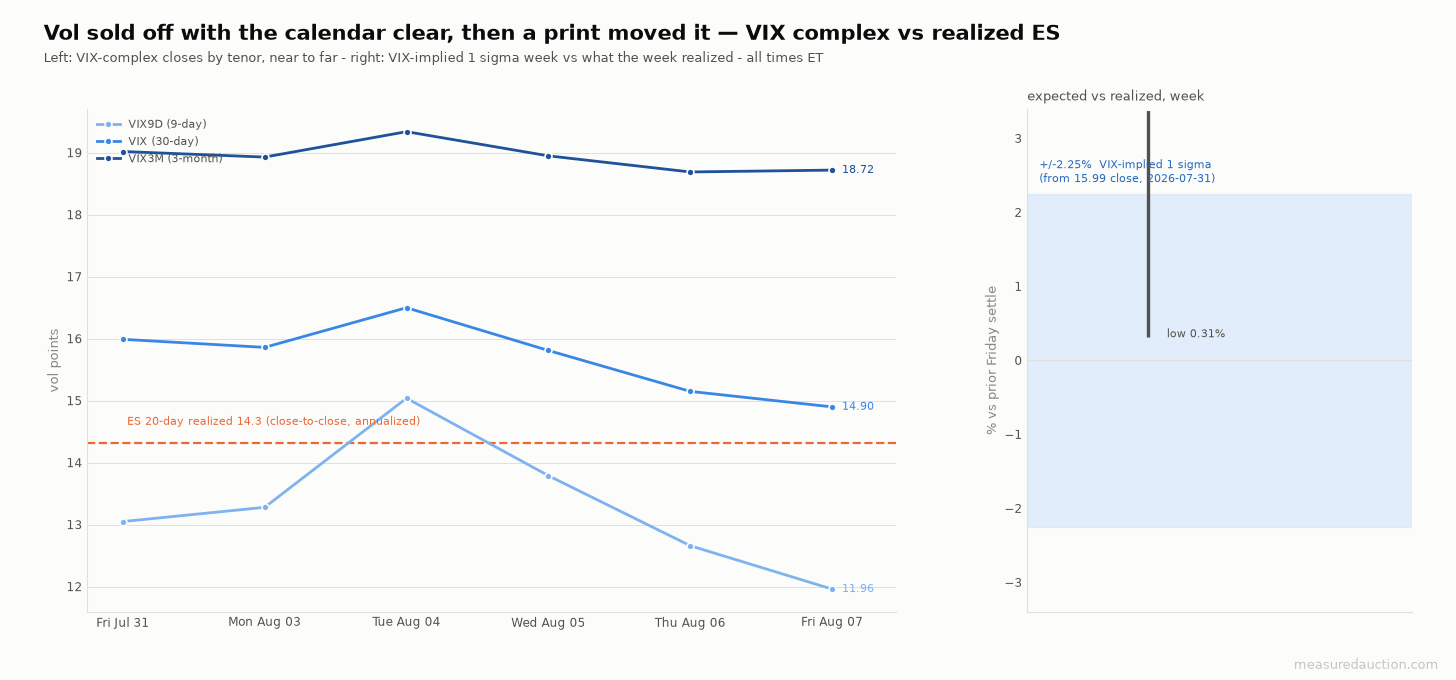
Vol sold off with the calendar clear, then a print moved it. Nine-day vol ends at 11.96, more than a point under where it started, on the day of a payrolls miss.
The volatility market spent the week getting cheaper into a print it was supposed to be pricing. VIX opened 16.03 Monday, ticked up to a 16.50 close Tuesday, then eased through Wednesday and Thursday to close Friday at 14.90. Nine-day vol moved with more amplitude: 13.28 at Monday's close, a 15.04 spike Tuesday, then straight down to 11.96 by Friday. That low for the week printed on the day of the jobs miss. The term structure never inverted: nine-day below thirty-day below three-month at every close, payrolls day included. That reads as a market that had already decided the number would not matter.
Scored against what had been paid for, the week ran hot. The prior Friday's VIX close, 15.99, implied a one-standard-deviation week of plus or minus 2.25%. Both the week's net move, 3.46%, and its range, 3.69% of that settle, ran past that band. ES 20-day realized volatility closed at 14.31, essentially level with VIX's own Friday close of 14.90, a complex that spent the whole week undercharging for the move it was about to get.
The week ahead
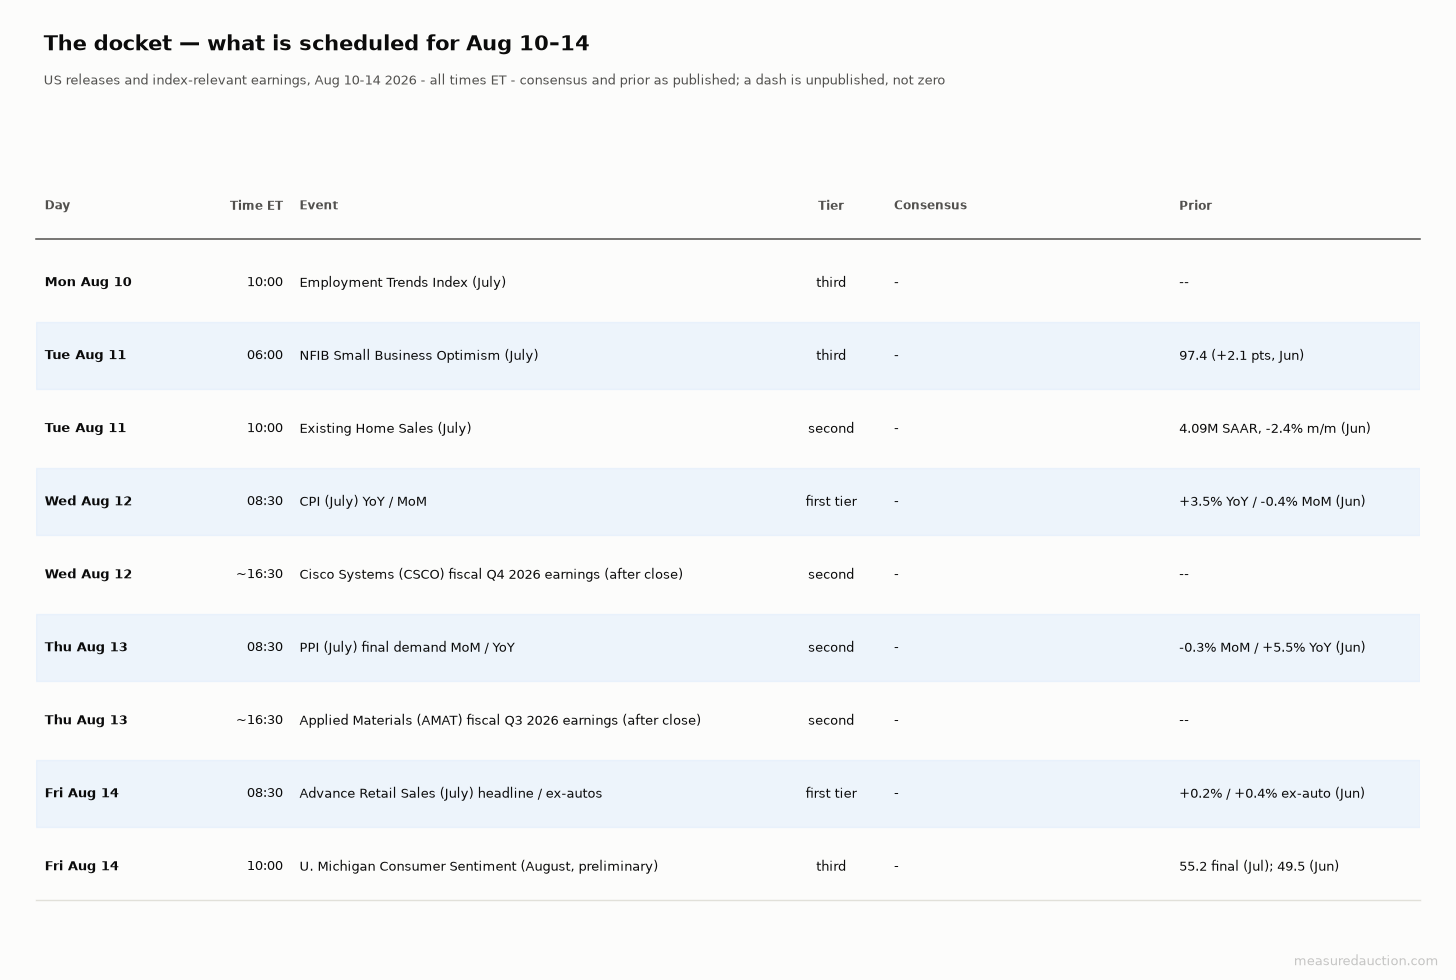
The docket. Consensus is shown where it has been published; a dash means unpublished, not zero.
Next week has no payrolls in it, and it is heavier on inflation instead [16]. Monday is light, an Employment Trends Index reading and nothing more. Tuesday adds NFIB small-business optimism before the bell, against a June reading of 97.4 [18], and existing home sales at 10:00, against a June reading of 4.09 million SAAR [17]. Wednesday is the week's first first-tier print, July CPI year-over-year and month-over-month at 08:30, against June's 3.5% and negative 0.4% [8][14], with Cisco reporting after the close [12].
Thursday brings PPI at 08:30, against a June prior of negative 0.3% month-over-month and 5.5% year-over-year [9][14], and Applied Materials after the close [13]. Friday closes the week with advance retail sales at 08:30, against June's 0.2% headline and 0.4% ex-autos [10][14]. The preliminary August University of Michigan sentiment read follows at 10:00, against a final July reading of 55.2 [11][15]. July's CPI, PPI and retail-sales consensus figures were not yet published by a standard survey source as of this writing. They are left blank in the docket rather than filled from a prediction market.
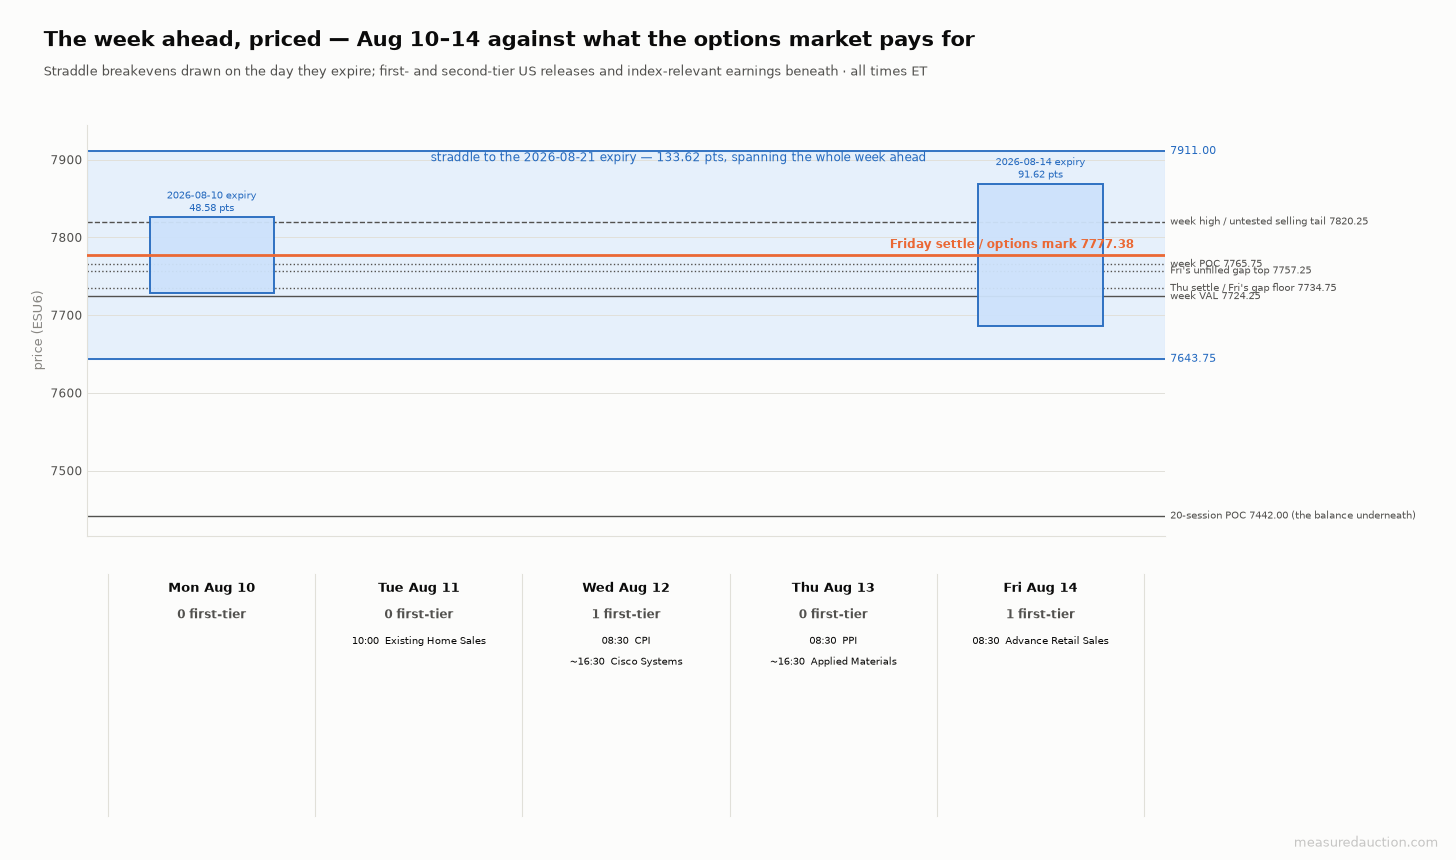
What is priced against what is scheduled. The band across the whole week is the Aug 21 straddle; the Aug 14 box is the nearer one that actually expires inside it.
What the options market pays for
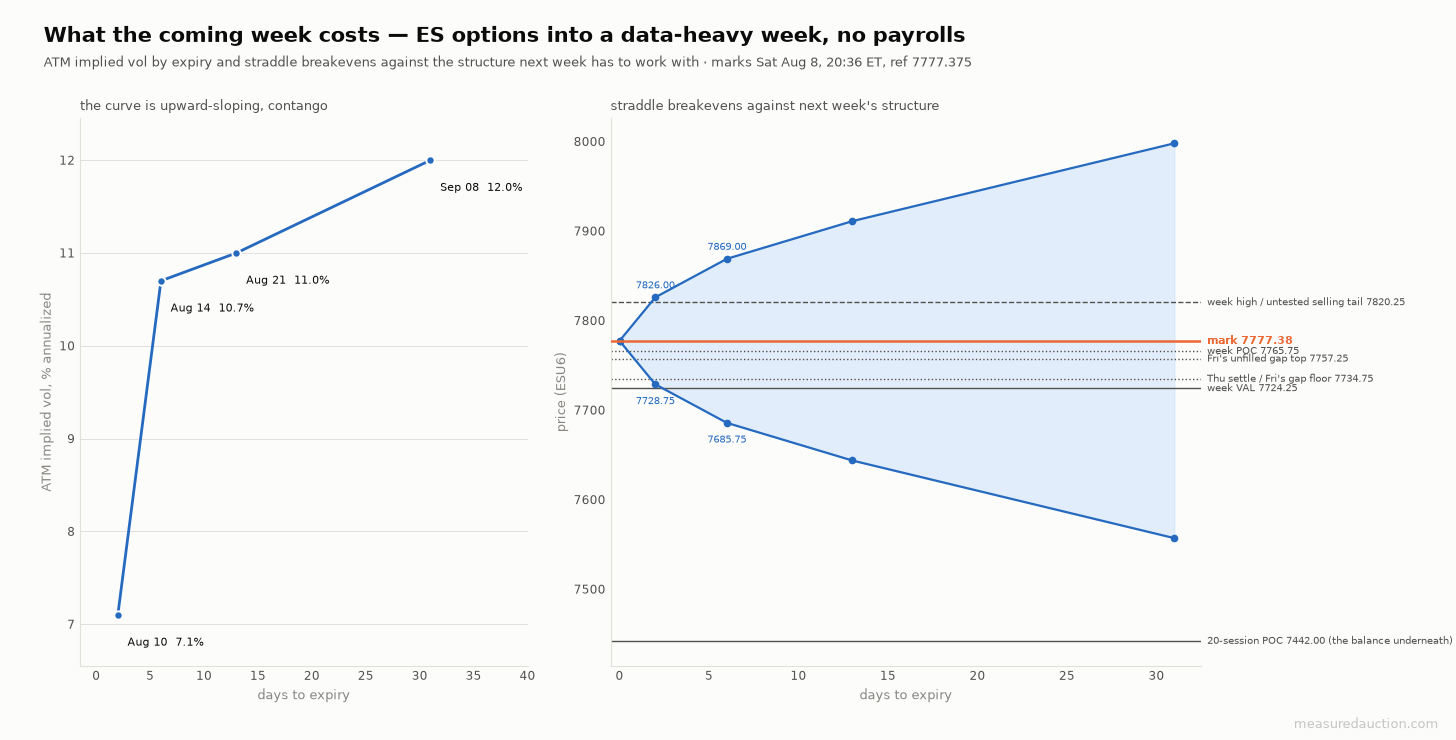
Marks taken Saturday against 7777.375. The curve is cleanly upward-sloping, contango, once the week's own event is behind it.
The nearest expiry that actually closes out next week is Aug 14, six days out. It costs 91.62 points of straddle, a call and a put at the money whose combined price is the market's breakeven for movement. Its breakevens are 7685.75 and 7869.00. The lower one sits 38.50 points below the week's value low, 7724.25; the upper one clears the week's own high, 7820.25, by 48.75 points. Monday's own expiry, two days out, costs 48.58 points, breakevens 7728.75 to 7826.00, a band that sits just above the week's value area, 7724.25 to 7812.25.
Against that, nine-day implied volatility closed Friday at 11.96, the cheapest reading on the board, heading into a week with CPI, PPI and retail sales all in it. The ES-specific comparison tells the same story from the other side: thirty-one-day at-the-money implied vol sits at 12.0% against 20-day realized of 14.3%, a ratio of 0.841. Realized is still running ahead of what the market is charging to sell it.
The read
Price closed the week at its high settle, 73.4% of the way up Friday's own range, on the session that absorbed the week's biggest surprise. Above that settle there is no repair work five points or wider left to do. The week's own value area, 7724.25 to 7812.25, does not overlap the 20-session value area at all. The nearest node with real volume behind it in the older distribution, 7612.50, is over a hundred points down.
I favor a push to fully auction off Friday's poor high, the 7786.75 print that did not get a clean rejection, while price holds above the week's value low, 7724.25. A poor high is unfinished business at the top, the same way a gap is unfinished business in the middle. The market tends to come back and trade through it, closing the business off properly. Nothing of size stands in the way above 7779.75. The options market is pricing a week-ahead band, 7685.75 to 7869.00, that comfortably contains a retest, and the path of least resistance runs through that level again.
I am not attaching a frequency to that lean. A poor high resolving higher inside the following week has not recurred often enough in my scored record to support a figure that would mean anything. A number here would be decoration.
What would change the read
Acceptance below 7724.25 does it, the week's own value low. Time spent trading beneath it, rather than a wick through it, puts Friday's gap floor, 7734.75, and Thursday's settle at the same level back in play as resistance instead of support. The intermediate warning is 7757.25, Friday's own unfilled gap top; a session that opens below it and builds value there is starting to give the week back rather than extend it.
The second thing that changes it is the calendar itself. CPI on Wednesday is the week's first first-tier print. The options market is charging comparatively little for the six days that contain it, 91.62 points against a week that just moved 260.50. A number that reopens the inflation debate the Fed is watching could do to next week what no single headline did to this one.
Sessions: RTH 09:30–16:15 ET; overnight (ETH) 18:00–09:30 ET. All levels computed from exchange data; nothing here is a trade recommendation.
References
News and releases:
[1] Yahoo Finance, "Markets News, Aug. 3, 2026: Dow Closes at Record; Stocks Surge to Begin August Trading; Oil Prices Sink as Trump Calls Off Iran Strikes." https://finance.yahoo.com/markets/stocks/articles/markets-news-aug-3-2026-105027728.html
[2] CNBC, "Oil prices today: WTI, Brent: Trump says he called off planned strike on Iran," Aug 3, 2026. https://www.cnbc.com/2026/08/03/oil-prices-today-wti-brent-hormuz-trump-iran.html
[3] Investrade, "Market Review: August 04, 2026." https://investrade.com/market-review-august-04-2026/
[4] Investrade, "Market Review: August 05, 2026." https://investrade.com/market-review-august-05-2026/
[5] Investrade, "Market Review: August 06, 2026." https://investrade.com/market-review-august-06-2026/
[6] Investrade, "Market Review: August 07, 2026." https://investrade.com/market-review-august-07-2026/
[7] STL.News, "U.S. Stock Market Today – Friday, August 7, 2026." https://www.stl.news/u-s-stock-market-today-friday-august-7-2026/
[8] U.S. Bureau of Labor Statistics, CPI news release schedule and June 2026 result. https://www.bls.gov/news.release/cpi.htm ; https://www.bls.gov/news.release/cpi.nr0.htm
[9] U.S. Bureau of Labor Statistics, PPI news release archive, confirms July 2026 release date of Aug 13. https://www.bls.gov/news.release/archives/ppi_07152026.htm
[10] U.S. Census Bureau, Advance Monthly Retail Trade release schedule. https://www.census.gov/retail/release_schedule.html
[11] University of Michigan, Surveys of Consumers. https://www.sca.isr.umich.edu/
[12] Cisco Systems investor relations, "Cisco Schedules Conference Call for Q4 Fiscal Year 2026 Financial Results." https://investor.cisco.com/news/news-details/2026/Cisco-Schedules-Conference-Call-for-Q4-Fiscal-Year-2026-Financial-Results/default.aspx
[13] Applied Materials investor relations, "Applied Materials to Report Fiscal Third Quarter 2026 Results on Aug. 13, 2026." https://ir.appliedmaterials.com/news-releases/news-release-details/applied-materials-report-fiscal-third-quarter-2026-results-aug
[14] Advisor Perspectives (dshort), June 2026 CPI, PPI and retail sales updates. https://www.advisorperspectives.com/dshort/updates/2026/07/14/cpi-consumer-price-index-inflation-june-2026 ; https://www.advisorperspectives.com/dshort/updates/2026/07/15/ppi-producer-price-index-wholesale-inflation-june-2026 ; https://www.advisorperspectives.com/dshort/updates/2026/07/16/retail-sales-june-2026
[15] edgeX Pro, "University of Michigan Final Consumer Confidence for July Comes in at 55.2, Above 54.0 Estimate." https://pro.edgex.exchange/news/article/michigan-consumer-sentiment-july-2026
[16] Investrade, "Weekly Event Calendar: 08/10/2026 - 08/14/2026." https://investrade.com/weekly-event-calendar-08-10-2026-08-14-2026/
[17] National Association of Realtors, "Existing-Home Sales Report Shows 2.4% Decrease in June." https://www.nar.realtor/newsroom/nar-existing-home-sales-report-shows-2-4-decrease-in-june
[18] NFIB, June 2026 Small Business Optimism survey, via Advisor Perspectives. https://www.advisorperspectives.com/dshort/updates/2026/07/14/nfib-small-business-optimism-survey-june-2026
Market data: price, volume, profile and session statistics computed from CME Globex ES September 2026 (ESU6) trade data, sessions as labeled (RTH 09:30–16:15 ET; ETH 18:00–09:30 ET), retrieved 2026-08-08.
Volatility series from Cboe daily index history CSVs (VIX, VIX9D, VIX3M), retrieved 2026-08-08.
ES options marks (CME E-mini S&P 500 options on futures, at-the-money strikes by expiry), retrieved 2026-08-08 20:36 ET, reference 7777.375.