ES Futures Recap & Week Ahead · Aug 3–7, 2026
The FOMC took 156.50 points out of Wednesday and earnings put them back; price closed inside the balance it left, and payrolls is Friday.

The Fed took 156.50 points out of the auction in eighty minutes on Wednesday afternoon. By Friday's settle the market had taken 193.00 of them back off the low and closed the week 71.75 points higher than it opened it. That round trip is the week. What matters now is where it left price. Back inside the balance it fell out of, with a stack of unrepaired work underneath, and a payroll print on Friday that near-dated volatility is treating as an ordinary day.
ES settled Friday at 7519.25, up 71.75 points on the week, 0.96% above the prior Friday's 7447.50. The week traded a 214.75-point range, 7541.00 down to 7326.25. All profiles here are regular-session only, 09:30 to 16:15 ET; the overnight Globex session enters as inventory, positions accumulated outside regular hours, and as gap context. All times are ET.
Last week in profile
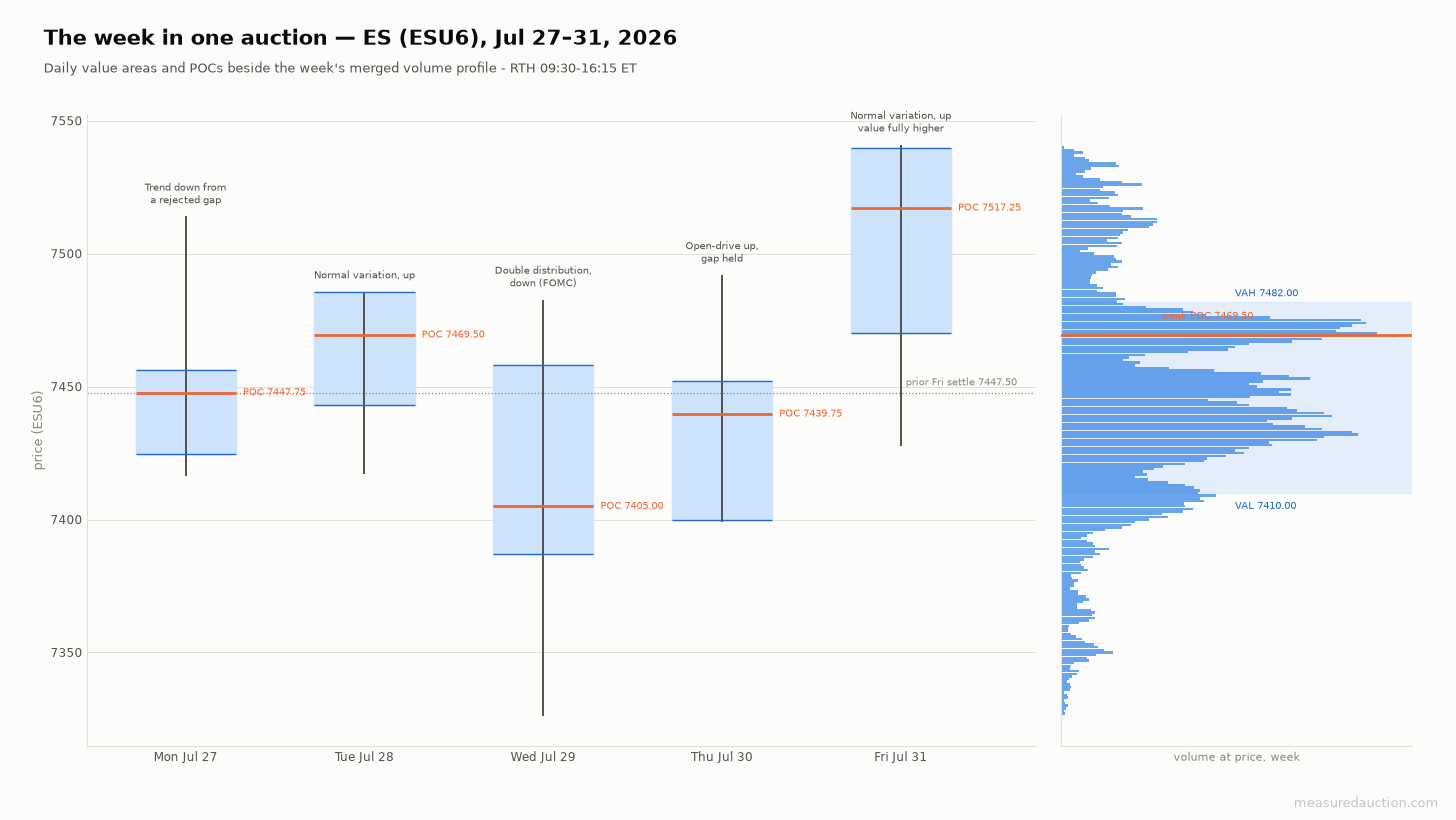
Five sessions on one scale. The week's own value settles at 7410.00 to 7482.00 with its point of control, the price with the most traded volume, at 7469.50. Friday's distribution sits almost entirely above it.
Monday was an inventory problem, not a news problem. The overnight session put 100.0% of its volume above the prior settle, as one-sided as the measure goes, and the open printed 7507.75, a 60.25-point gap over 7447.50. Nothing corrected before the bell. The high came at 09:35 and the rest of the day was liquidation. Down to 7416.25 by 13:15, then a close at 7448.00, only 32% of the way up the range, on 116% of the 20-day average volume. The cash index finished the day essentially flat. Everything ES gave back was the overnight length unwinding, and the 34.75-point selling tail off the high says the sellers who took the other side never had to chase.
Tuesday did almost nothing, which is what a market does the day before a Fed decision. It was the narrowest session of the week at 68.75 points, on 103% of average volume, and value migrated modestly higher to 7443.00 to 7485.50.
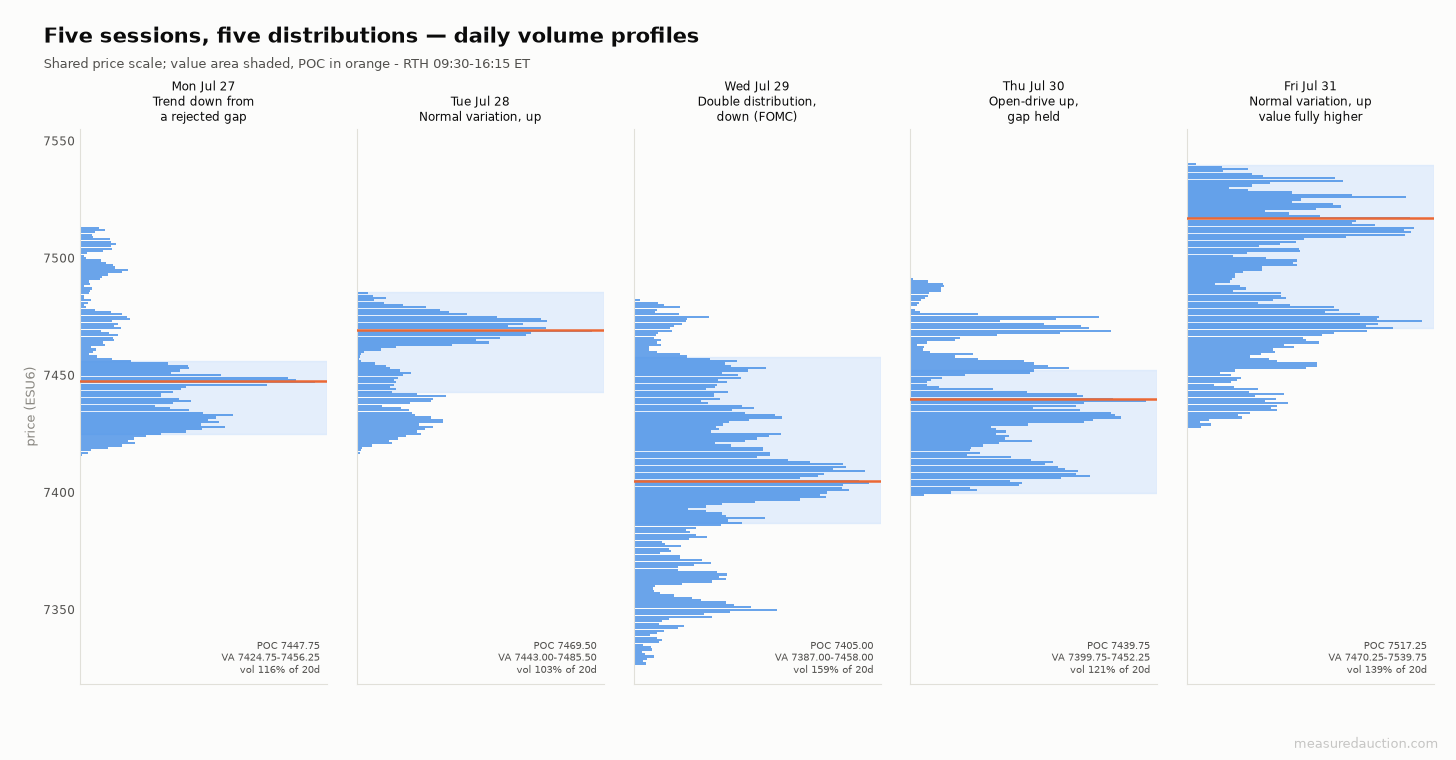
The shapes carry the argument. Monday and Wednesday build downward-skewed distributions; Thursday and Friday rebuild them upward on more volume. Friday is the only session all week whose value area does not overlap the prior day's.
Wednesday is the session worth studying. The Fed held its target range at 3.50% to 3.75%, with three of the twelve voters dissenting in favor of a 25 basis point increase [1]. The tape liked it: 7419.50 at 13:55, 7437.25 at 14:00, a 17.75-point move in a single five-minute bucket on 41,013 contracts. That is a timestamped response, and it is the only clean one of the week.
Then Fed Chair Warsh took questions and offered no forward guidance [2][3]. Price kept rising for twenty minutes into the press conference, marking the session high at 7482.75 at 14:50, and then went one direction for the remaining eighty minutes of the session. The low printed 7326.25 at 16:10. That is 156.50 points of continuous liquidation with no meaningful bounce, on 159% of average volume, closing at 7336.50, 6% off the low. The range extended 72.00 points below the initial balance, the first hour's range. The bond market told the same story from the other side: the 30-year yield reached 5.24%, a 19-year high [2].
The important structural detail is what the session did not leave. A 19.50-point buying tail at 7326.25 is real excess, the mark of an auction that found a price too low and rejected it in a single bracket. That low has held since.
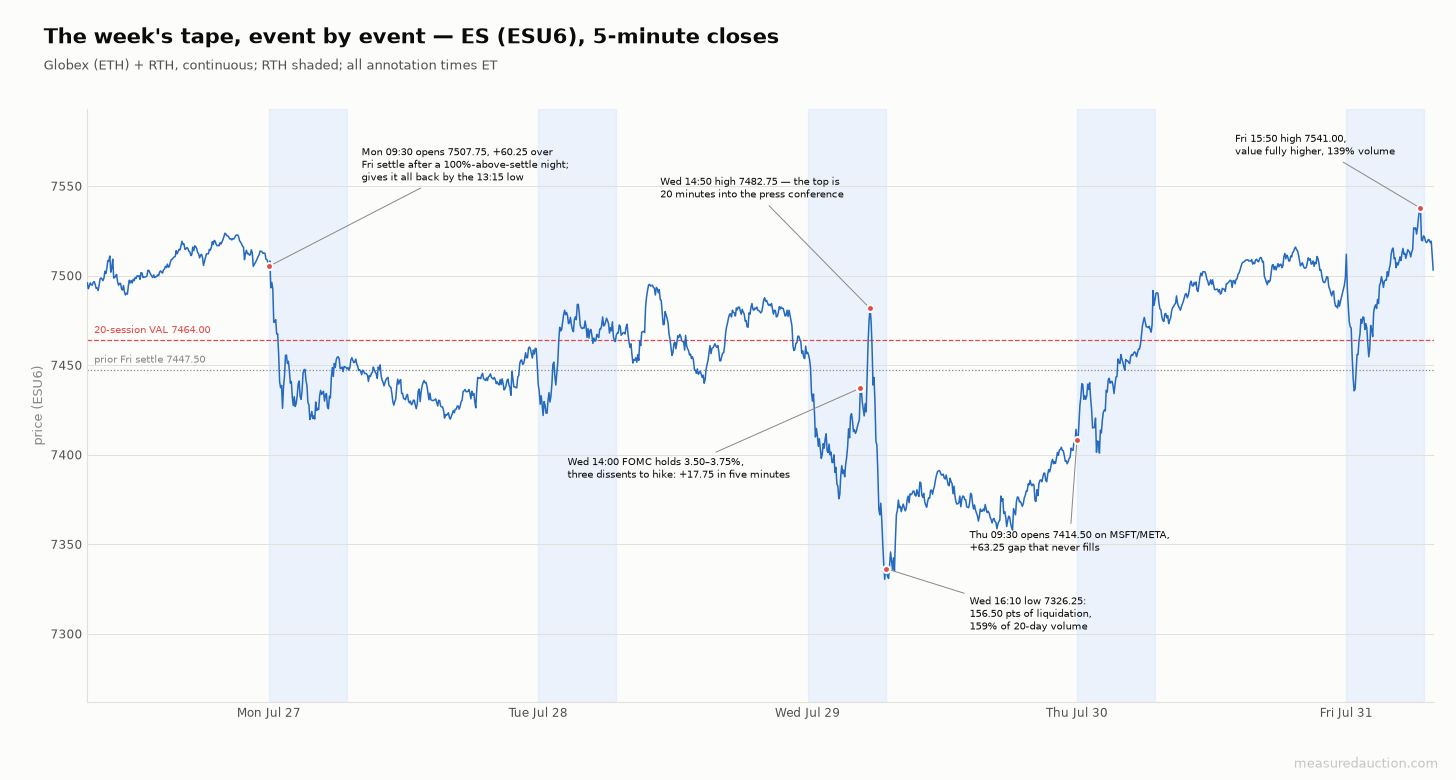
The whole week in one line. Note where the top is: twenty minutes into the press conference, not at the decision. The decision was a 17.75-point rally.
Microsoft and Meta reported after the close, and the repair started in the dark. Microsoft beat with Azure growing 43%; Meta beat on revenue, missed on earnings, and showed free cash flow of $784 million against a raised capital spending plan [7][8]. Overnight traded down to 7324.00, marginally through Wednesday's low, and then recovered continuously to 7414.25 by the open.
Thursday opened at 7414.50, a 63.25-point gap above the 7351.25 settle, and never traded back to it. Regular-session volume ran 121% of average and the session's net aggressive buying, +33,246 contracts, was the largest of the week by a wide margin. It closed at 7486.75, 94% of the way up its range. Apple and Amazon reported after that close, Amazon with revenue of $200.6 billion and AWS up 37%, Apple with a record June quarter but soft services and China [8].
Friday finished the job. June personal consumption expenditures came in at 3.7% headline and 3.3% core year over year, core in line [7]. The session opened at 7499.00, dipped to 7427.50 by 10:15, then climbed for five hours to 7541.00 at 15:50 and settled at 7519.25 on 139% of average volume. Value migrated fully higher for the first time all week, 7470.25 to 7539.75, with no overlap into Thursday's range. Underneath the equity strength the long end kept selling: the 10-year yield traded above 4.7%, its highest since January 2025, and the 30-year finished at 5.25% [7].
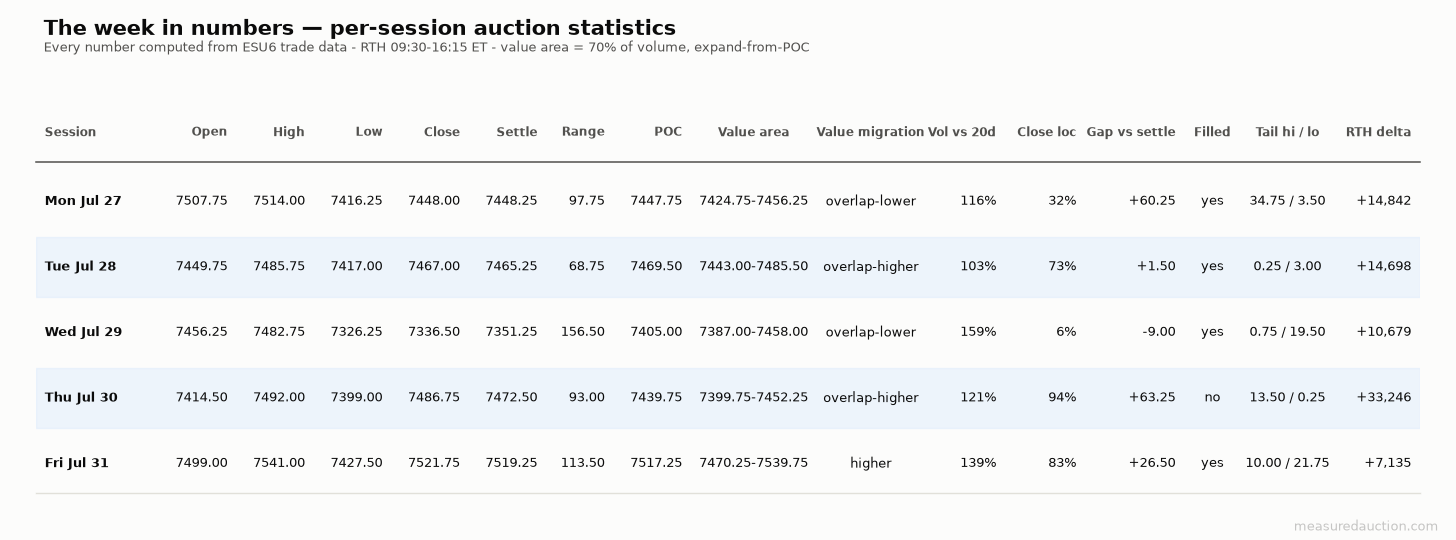
Every session's numbers. Two facts carry the week: Wednesday and Friday are its highest-volume sessions, and they point in opposite directions.
What broke, and what got repaired
An auction leaves work behind in three shapes. Excess is a tail of prices touched in only one half-hour bracket at an extreme. Single prints are the same thing in the middle of a distribution. An unfilled gap is an open the session never traded back from. Each is a place the market moved through without doing business, and each tends to draw price back eventually.
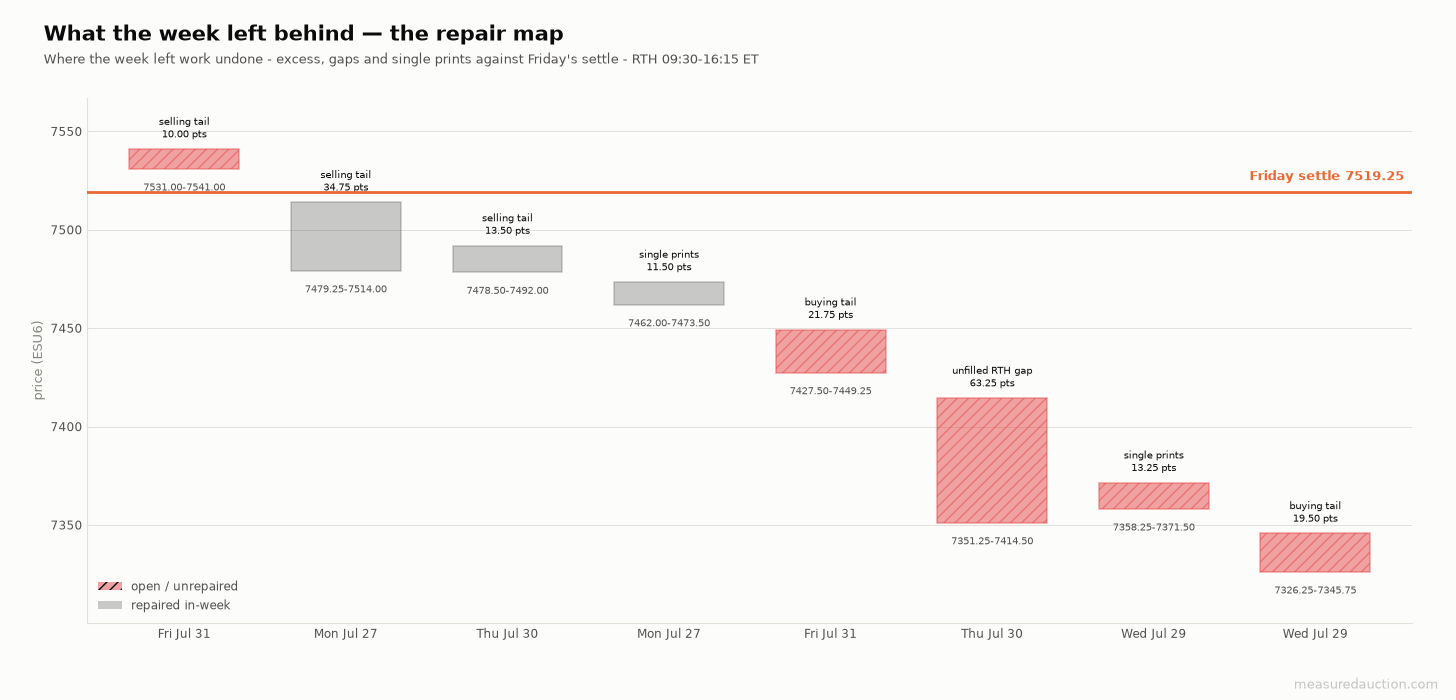
Eight zones wide enough to matter. Three were repaired inside the week. Five were not, and only one of those is overhead.
The asymmetry is the point. Above Friday's settle there is exactly one piece of unfinished business: a 10.00-point selling tail from 7531.00 to 7541.00, and price closed 11.75 points beneath it. Below, there are four zones spanning from 7449.25 down to 7326.25, headlined by that 63.25-point Thursday gap between 7351.25 and 7414.50. Thursday's regular session never entered it. Only the Globex hours did, which is a weaker form of repair.
Monday's 34.75-point selling tail and its interior single prints were both traded clean through by Friday. That is the tell that Thursday and Friday were not a bounce. A bounce respects the levels that broke it; this one went through them without slowing.
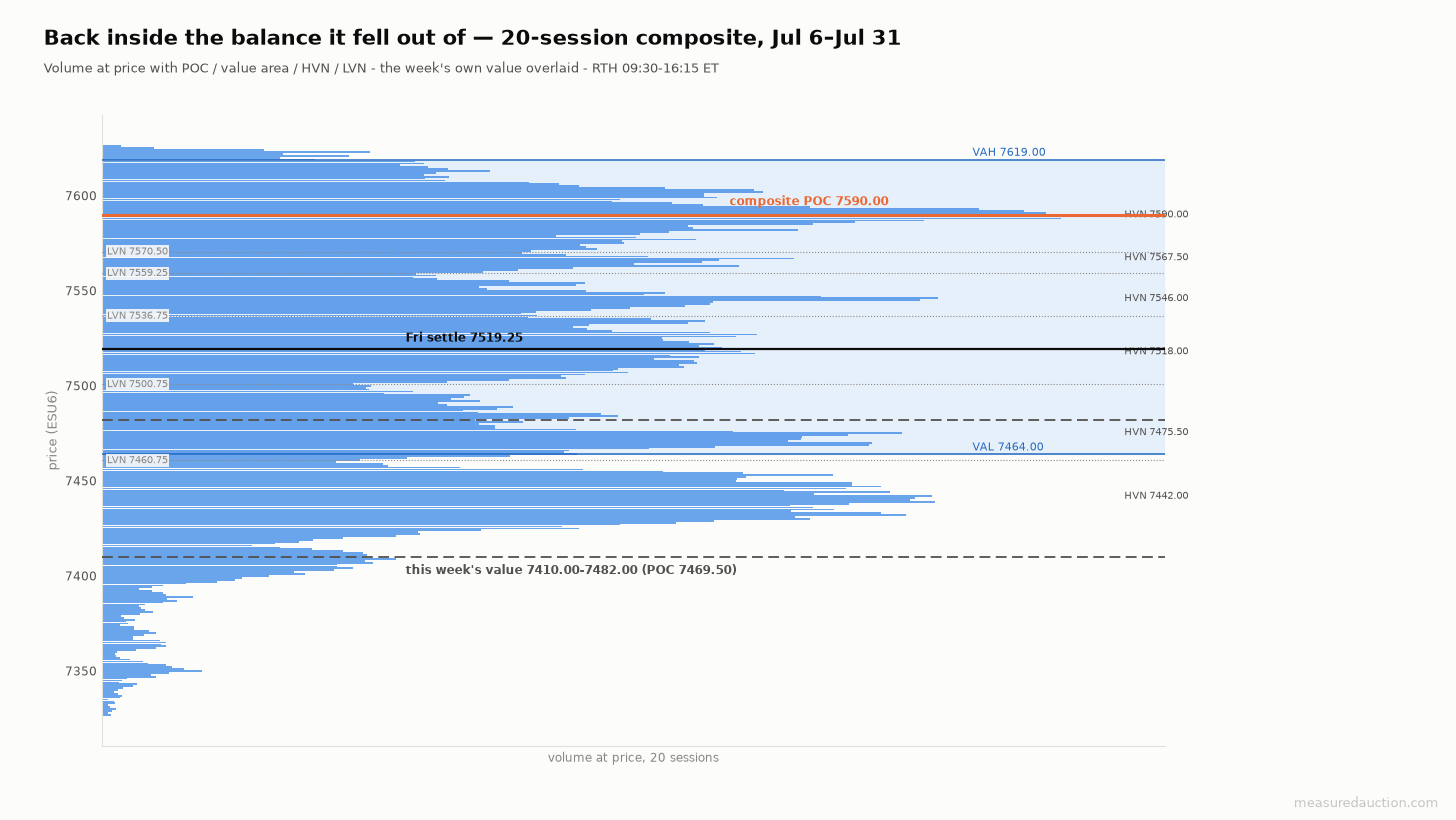
The wider frame. The 20-session distribution still has its point of control at 7590.00, 70.75 points above Friday's settle, and its value low at 7464.00. Price spent Wednesday below that edge and finished the week comfortably back inside.
I want to be careful about the frame here, because the three windows disagree. The 20-session composite puts value at 7464.00 to 7619.00 with its heaviest node at 7590.00. The 10-session window, which begins mid-selloff, puts value at 7397.00 to 7500.50 with a point of control at 7442.00. The week's own five sessions say 7410.00 to 7482.00. Friday settled above all three points of control and inside only the widest value area.
That combination has a name in this framework. Price sits at the upper edge of the recent distribution and inside the older one. The older distribution's unfinished business, the 7590.00 node, is therefore the nearest structure with real volume behind it. The nodes between here and there are thin: 7536.75 and 7559.25 are low-volume shelves, prices the market has historically passed through rather than settled on.
What volatility did
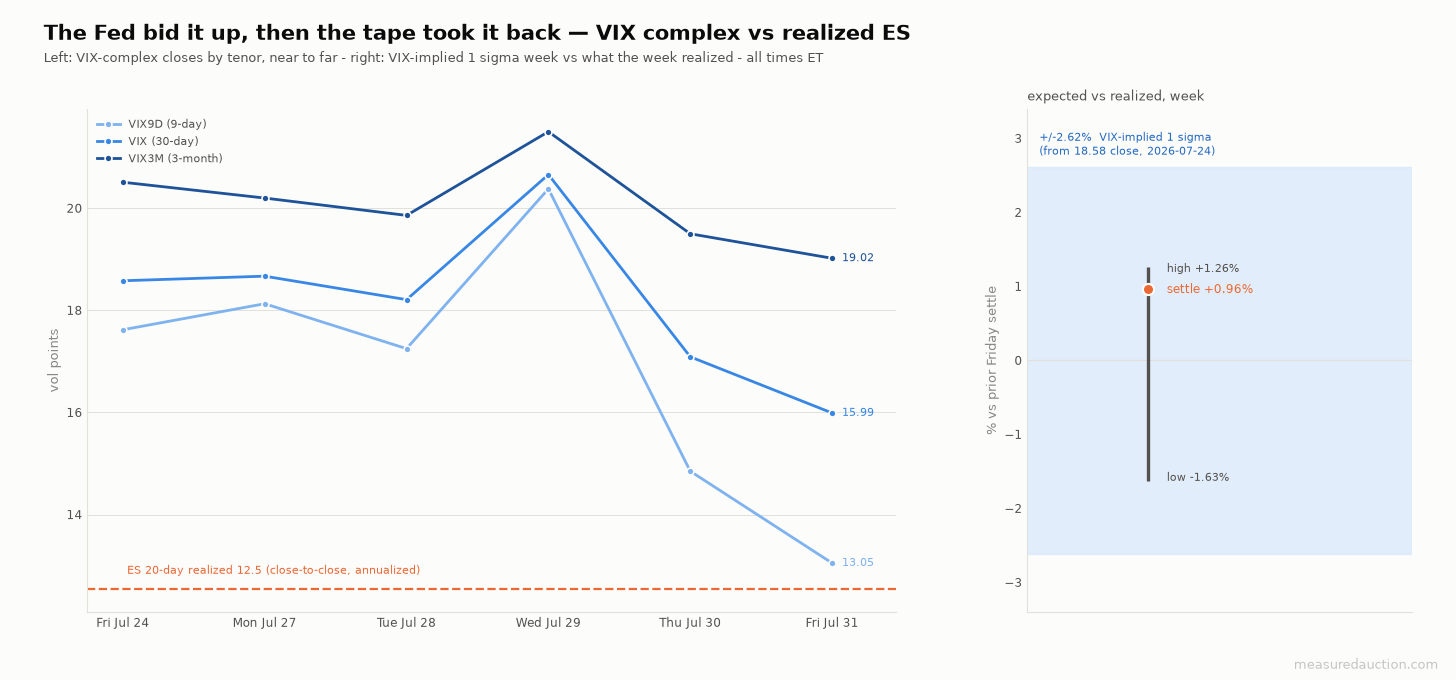
Implied vol spiked one day, then gave up more than it gained. Nine-day vol ends at 13.05, four and a half points under where it started, going into a payrolls week.
The volatility market treated Wednesday as an event and everything after it as resolution. VIX went into the week at 18.58, closed at 20.66 on the decision day, then 17.09, then 15.99. Nine-day vol did the same trip with more amplitude, 17.62 to 20.38 and down to 13.05. The term structure never inverted: nine-day below thirty-day below three-month at every close, Wednesday included. That is a market pricing a scheduled event, not a market that is frightened.
The scoring of the week is less flattering to the options market than last week's was. From the prior Friday's VIX close of 18.58, the implied one-standard-deviation week was plus or minus 2.62%. The week's extremes reached +1.26% and −1.63% against that Friday settle, both inside the band, and it settled +0.96%. A 214.75-point range that felt violent on Wednesday afternoon still fit inside what had been paid for.
What has changed underneath is the premium itself. ES 20-day realized volatility rose from 10.65 to 12.54 across the week, because Wednesday and Friday are now inside the window. Thirty-day at-the-money implied on the ES surface is 13.2%. That is a ratio of 1.05, against 1.35 a week ago. The cushion that made selling premium comfortable through July is largely gone, and it went not because implied fell but because realized caught up.
The week ahead
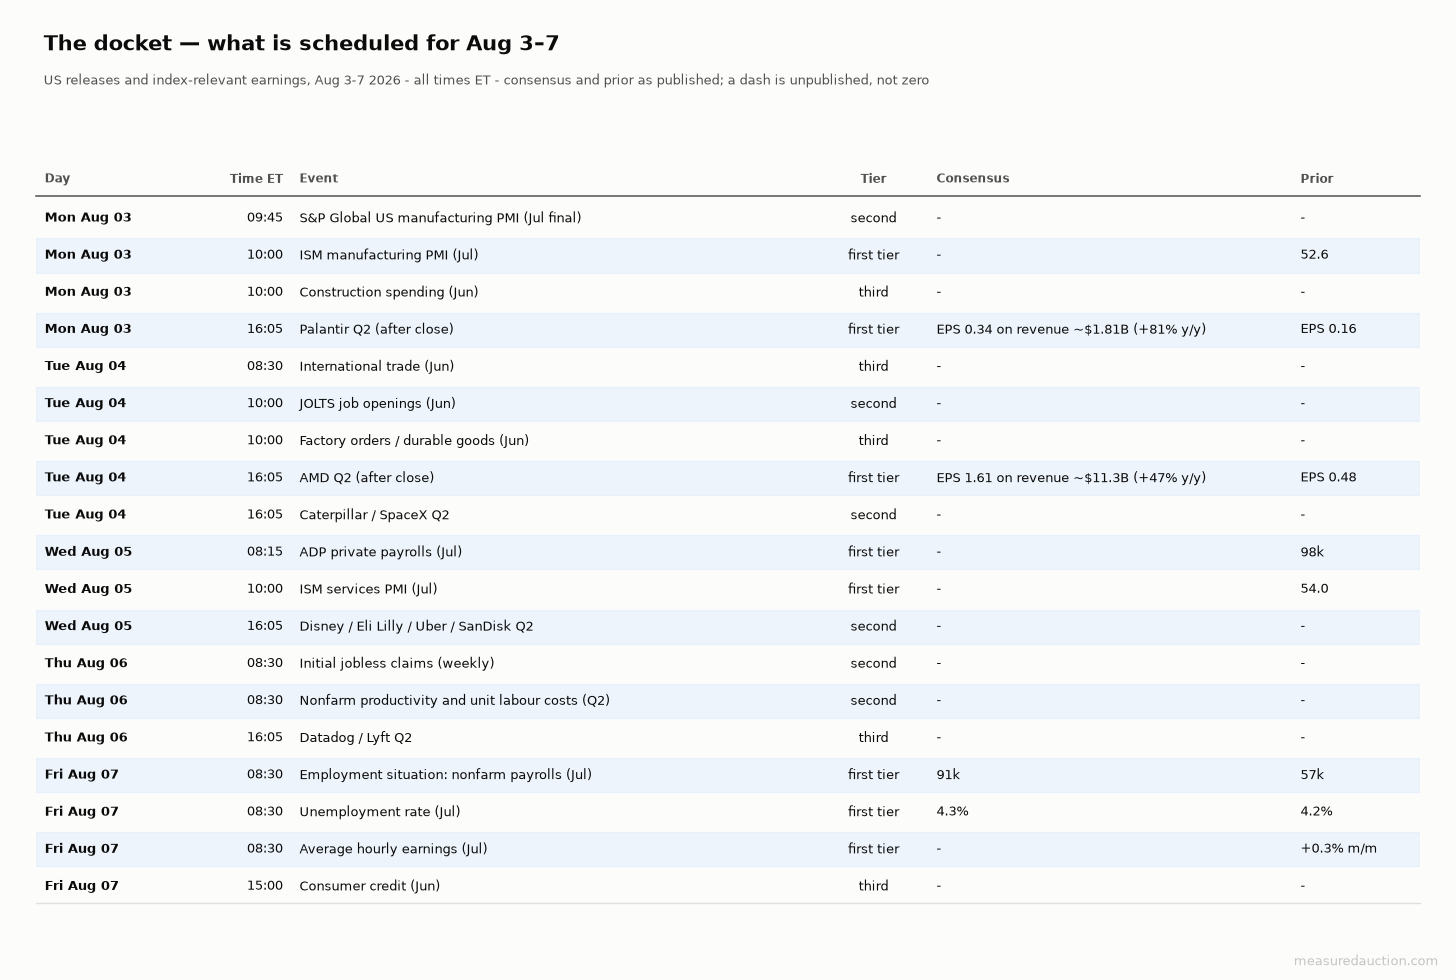
The docket. Consensus is shown where it has been published; a dash means unpublished, not zero.
The week is back-loaded and the back end is labour. Monday brings ISM manufacturing against a prior of 52.6, and Palantir after the close, where the options market is paying for a move north of 12% [11]. Tuesday is quieter on data, with JOLTS mid-morning, and heavier after the bell: AMD is expected to earn $1.61 on revenue near $11.3 billion, up about 47% from a year ago [12]. Wednesday stacks ADP private payrolls at 08:15 against a 98k prior and ISM services at 10:00 against 54.0, then Disney, Eli Lilly and Uber after the close [9][10].
Friday is the week. July nonfarm payrolls are expected at 91,000 against 57,000 in June, with the unemployment rate seen ticking up to 4.3% from 4.2% [13]. Three first-tier numbers land in the same 08:30 minute.
The macro frame that gives those numbers their weight is the one Wednesday established. The Fed is on hold at 3.50% to 3.75% with three voters wanting to go higher. Core inflation is running at 3.3%, and futures markets price better-than-even odds of an increase in September [3][4]. The long end has already moved: a 19-year high on the 30-year and the highest 10-year since January 2025. That configuration inverts the usual reflex. A strong payroll print is not straightforwardly good news for equities when the bond market is the thing setting the discount rate and the next Fed move under discussion is up.
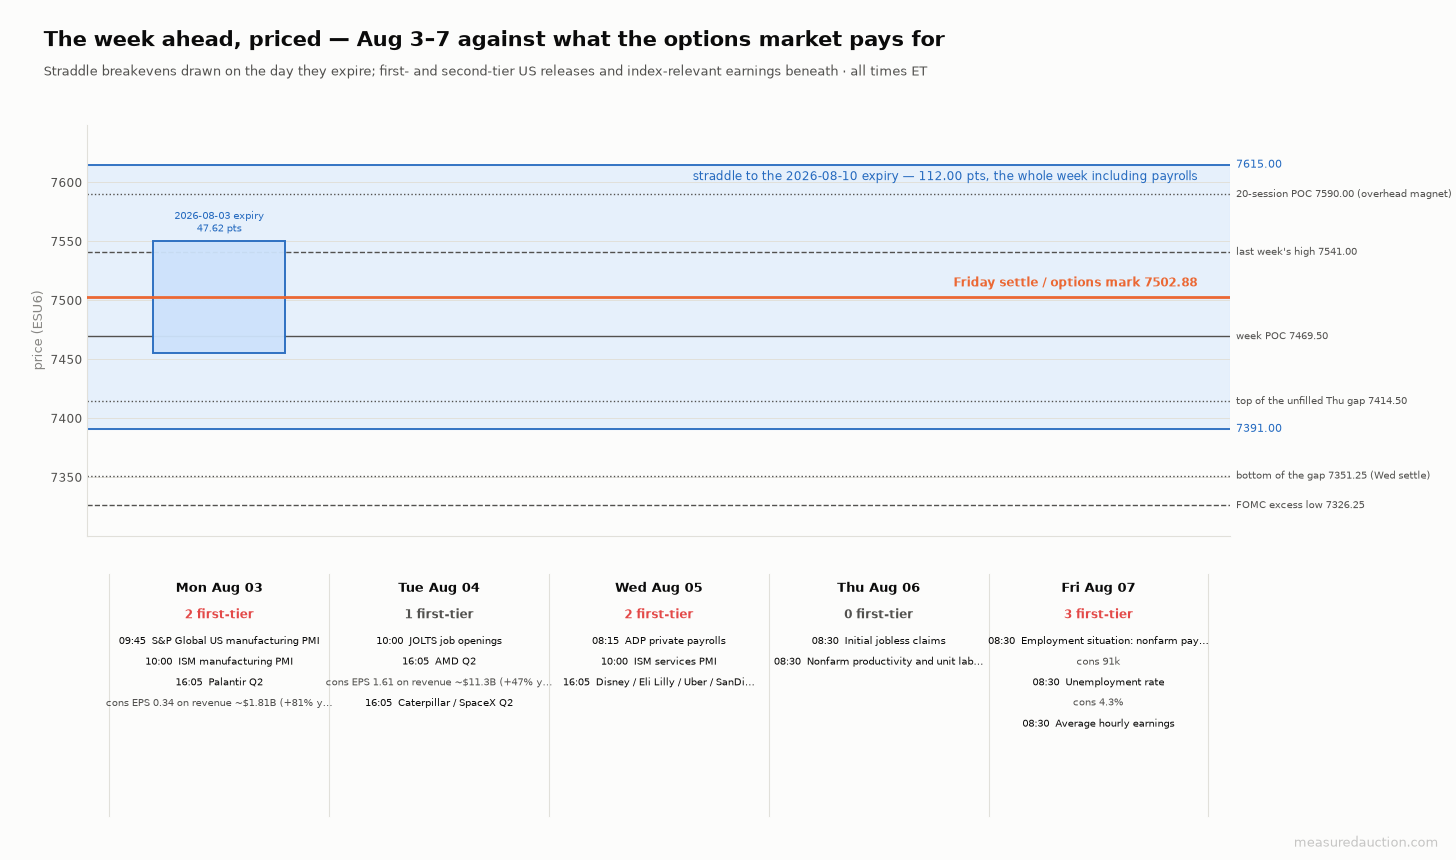
What is priced against what is scheduled. The band across the whole week is the Aug 10 straddle, the nearest expiry that spans Friday's payroll report.
There is a limitation worth stating plainly. The options snapshot I work from carries the Aug 3, Aug 10, Aug 17 and Sep 1 ES expiries. There is no Friday Aug 7 expiry in it, so I cannot isolate what the payroll session alone costs. Everything below uses the Aug 10 expiry, which spans the entire week including the print.
What the options market pays for
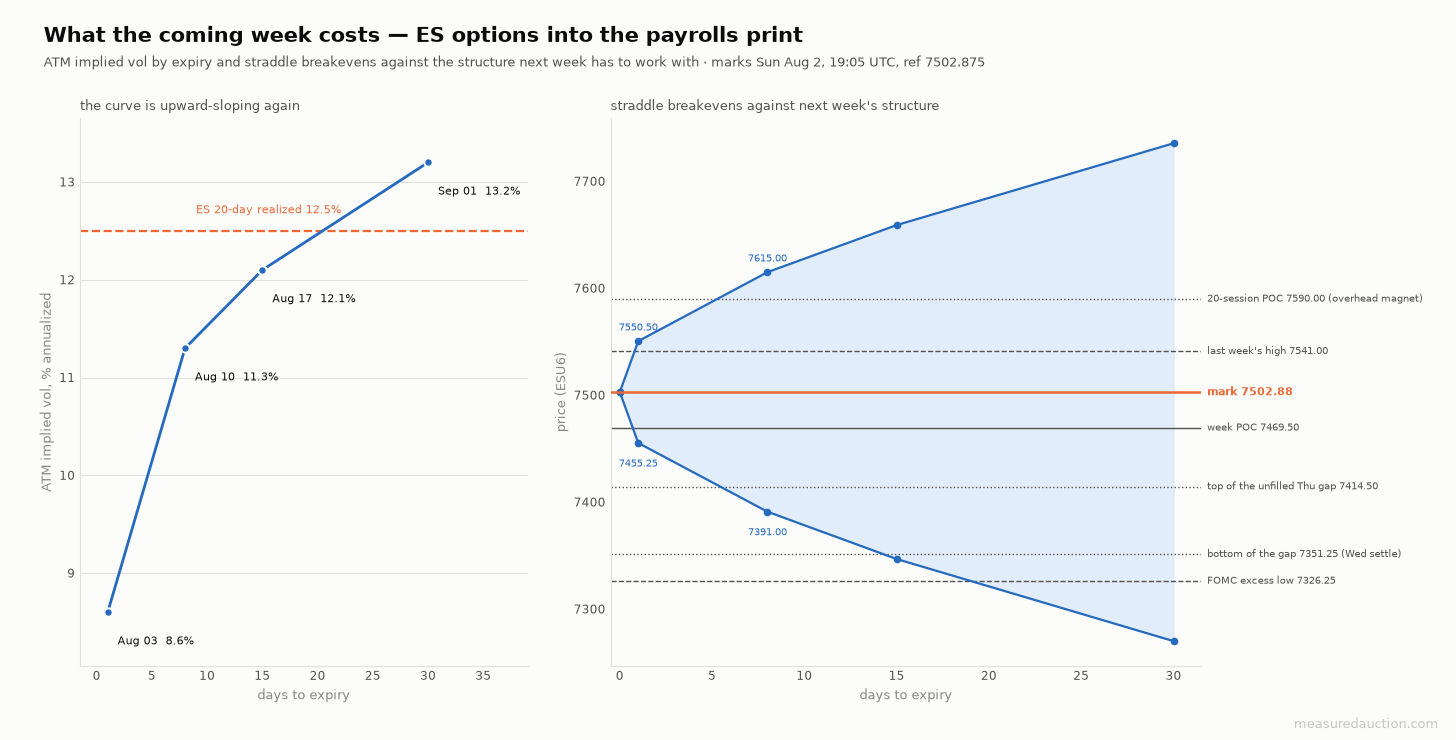
Marks taken Sunday against 7502.875. The curve is cleanly upward-sloping again. That is its shape once the calendar's known event has passed and the next one is far enough out to be priced by time.
Two numbers do the work. Monday alone costs 47.62 points of straddle, a call and a put at the money whose combined price is the market's breakeven for movement. Its upper breakeven is 7550.50, which sits 9.50 points above last week's high. The whole week through the Aug 10 expiry costs 112.00 points, with breakevens at 7391.00 and 7615.00.
Both of those land on structure, and that is the interesting part. The upper weekly breakeven at 7615.00 sits 25.00 points past the 20-session point of control. A full one-straddle move up is therefore priced to reach the overhead node and slightly beyond. The lower breakeven at 7391.00 lands inside the unfilled Thursday gap, not below it, and 64.75 points above the Fed low. In other words, the options market is paying for a move that reaches the heavy node above or the empty pocket below, and for nothing more extreme than that in either direction.
Against that, nine-day implied volatility closed the week at 13.05. That is the cheapest reading of the complex, in a week with a payroll report and two ISM surveys in it. The market's own term structure says the near dates are quiet and the risk is further out. The calendar says the opposite.
The read
Price settled the week at 7519.25. That is above the point of control of every window I look at, above its own weekly value high of 7482.00, and back inside the 20-session value area it left on Wednesday. It got there on the week's two highest-volume sessions. It also repaired Monday's excess on the way through instead of stalling at it.
I favor continuation toward 7590.00 while price holds above 7482.00. The reasoning is structural. The nearest overhead level with real volume behind it is the 20-session point of control, and the shelves between here and there at 7536.75 and 7559.25 are thin. The straddle priced through Friday reaches past that node. The single piece of unfinished business overhead, the 10.00-point tail from 7531.00 to 7541.00, sits directly in the path and is the first thing that has to give.
What would change the read
Acceptance below 7464.00 does it. That is the 20-session value low and the edge Wednesday broke. Time spent trading beneath it, rather than a wick through it, puts the week back into the lower distribution. At that point the 63.25-point gap from 7414.50 down to 7351.25 becomes the live question. The intermediate warning is 7469.50, the week's own point of control, roughly five points above it. A session that opens above and then builds value below both is the sequence that invalidates everything above.
The second thing that changes it is Friday, and it may not change it in the direction the headline suggests. Three voters dissented for a hike and the long end is at 19-year highs. Against that, a payroll number well above the 91,000 consensus can pressure the index through rates as readily as a weak one does through growth. The asymmetry I would watch is not the print's direction but whether the response holds above 7482.00 into the following Monday.
This brief is educational market commentary, not investment advice or a recommendation. It does not consider any reader’s financial situation, objectives, or risk tolerance, and past patterns described here are not a guarantee of future results. Futures and options trading carries substantial risk of loss and is not suitable for every investor.
References
News and releases:
[1] Fed meeting recap: July 2026, CNBC. https://www.cnbc.com/2026/07/29/fed-meeting-today-live-updates.html
[2] Week ended July 31, 2026: volatile month draws to a close, emorningcoffee. https://www.emorningcoffee.com/post/week-ended-july-31-2026-volatile-month-draws-to-a-close
[3] Kevin Warsh Says Fed Will 'Deliver Price Stability' After Decision to Hold Rates at July Meeting, Chase. https://www.chase.com/personal/investments/learning-and-insights/article/kevin-warsh-july-2026-federal-reserve-will-deliver-price-stability
[4] Odds of a September Fed rate hike climb to 54% as Warsh holds steady in July, Kalshi. https://news.kalshi.com/p/september-fed-rate-hike-odds-54-percent
[5] Stock market news for July 27, 2026, CNBC. https://www.cnbc.com/2026/07/26/stock-market-today-live-updates.html
[6] Stock market today, Monday July 27 2026, Yahoo Finance. https://finance.yahoo.com/markets/live/stock-market-today-monday-july-27-dow-sp-500-nasdaq-080412540.html
[7] S&P 500 closes higher Friday as Amazon surges; Dow posts fourth straight winning month, CNBC. https://www.cnbc.com/2026/07/30/stock-market-today-live-updates.html
[8] Microsoft, Amazon, Apple: the big tech earnings scorecard, TradingKey. https://www.tradingkey.com/analysis/stocks/us-stocks/262067315-big-tech-earnings-scorecard-microsoft-amazon-apple-july-31-2026-tradingkey
[9] Weekly event calendar, 08/03/2026 to 08/07/2026, Investrade. https://investrade.com/weekly-event-calendar-08-03-2026-08-07-2026/
[10] Economic calendar for 03.08.2026 to 09.08.2026, LiteFinance. https://www.litefinance.org/blog/analysts-opinions/weekly-economic-calendar-for-03082026-09082026/
[11] Palantir earnings: date, expected move and what to know, CM Elite Group. https://www.cmelitegroup.com/knowledge-hub/palantir-earnings-date-expected-move/
[12] The week ahead: US July non-farm payrolls in focus, TradingKey. https://www.tradingkey.com/analysis/stocks/us-stocks/262068819-weekly-preview-us-july-non-farm-payrolls-data-market-focus-pltr-sandisk-amd-spacex-earnings-reports-tradingkey
[13] What to look out for in economic data this week, August 3 to 7, Kiplinger. https://www.kiplinger.com/investing/economy/this-weeks-economic-calendar
[14] Cboe daily index history, VIX, VIX9D, VIX3M. https://cdn.cboe.com/api/global/us_indices/daily_prices/VIX_History.csv
Market data: price, volume, profile and session statistics computed from CME Globex ES September 2026 (ESU6) trade data, sessions as labeled (RTH 09:30–16:15 ET; ETH 18:00–09:30 ET), retrieved 2026-08-02.
Volatility series from Cboe daily index history CSVs (VIX, VIX9D, VIX3M), retrieved 2026-08-02.
ES options marks (CME E-mini S&P 500 options on futures, at-the-money strikes by expiry), retrieved 2026-08-02 18:05 UTC, reference 7502.875.