
ES lost 113.75 points last week and the regular session did nearly all of it. The contract settled Friday at 7691.25 against the prior Friday's 7805.00, a fall of 1.46%. That move happened inside a 150.5-point range, 7659.00 up to 7809.50, which is 1.93% of where the week started. Every one of the five regular sessions closed beneath its own open.
All profiles here are regular-session only, 08:30 to 15:15 CT. The overnight Globex session enters as inventory, positions accumulated outside regular hours, and as gap context. Times throughout are CT.
The week in profile
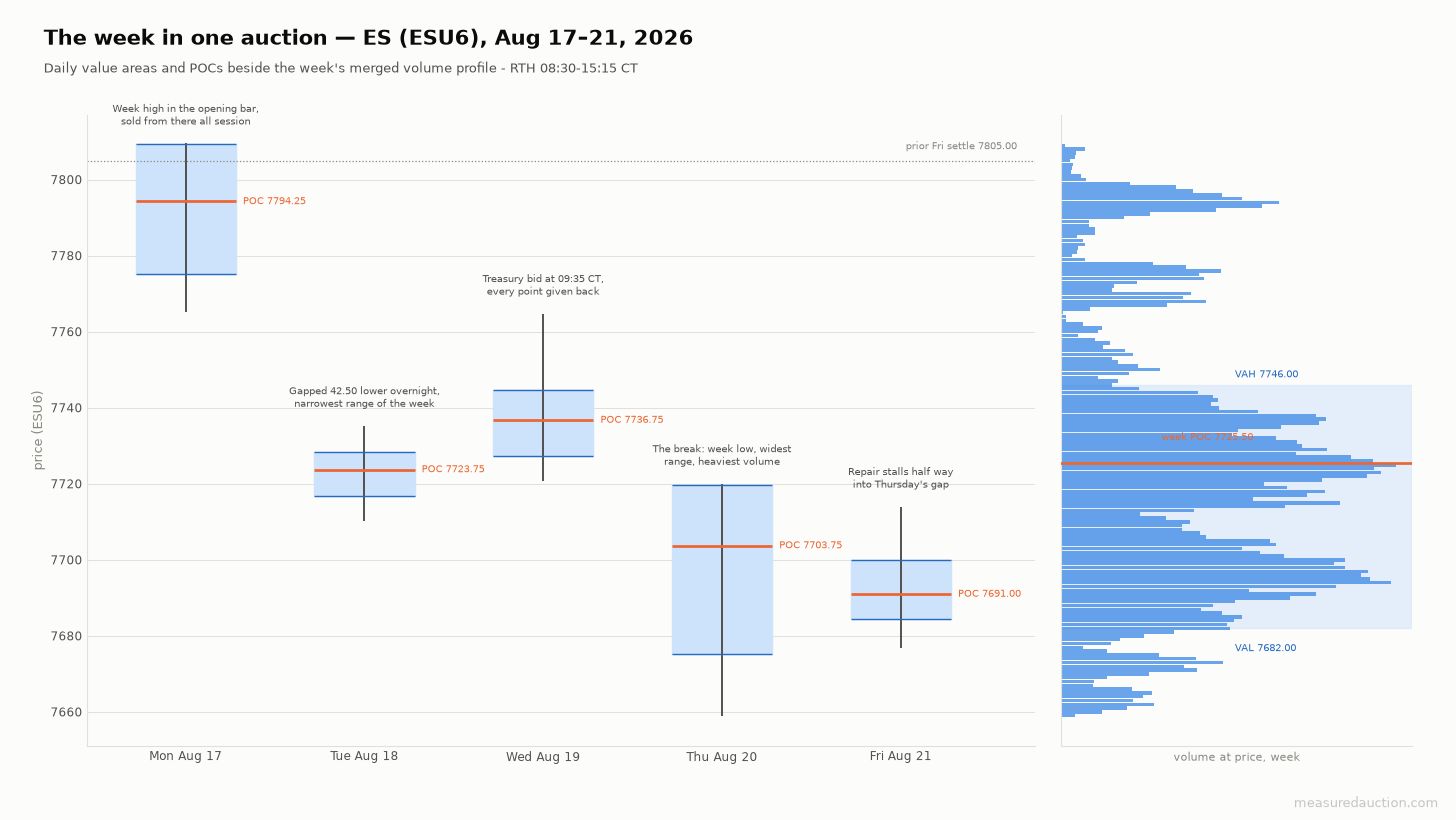
Five sessions on one scale. Value stepped down almost every day, and the week's merged profile set its point of control, the price that traded the most volume, at 7725.50.
Monday printed the week high 7809.50 inside the opening bar and never traded there again. The initial balance, the first hour's range, contained the entire upside for the session: extension above it came to zero points. Price held near 7794.00 through the morning, then stepped lower from 12:00 CT. It settled 7768.75 on 76% of the twenty-day average volume, the lightest session of the week. Oil rose on renewed concern that the conflict between the US and Iran could reignite, with Brent near $91, and the thirty-year Treasury yield reached its highest since 2007 [1][3].
Tuesday did its work while the cash market was shut. The overnight auction sold from 7770.50 down to 7716.50, and the open at 7726.25 sat 42.50 points beneath Monday's settle. That gap has not filled. What followed was the narrowest range of the week, 25.00 points, on 95% of average volume, and value migrated lower by the largest displacement of the week. A semiconductor gauge fell 5% as Nvidia and Broadcom weighed on the index, and the thirty-year yield touched 5.33% [4][5][6].
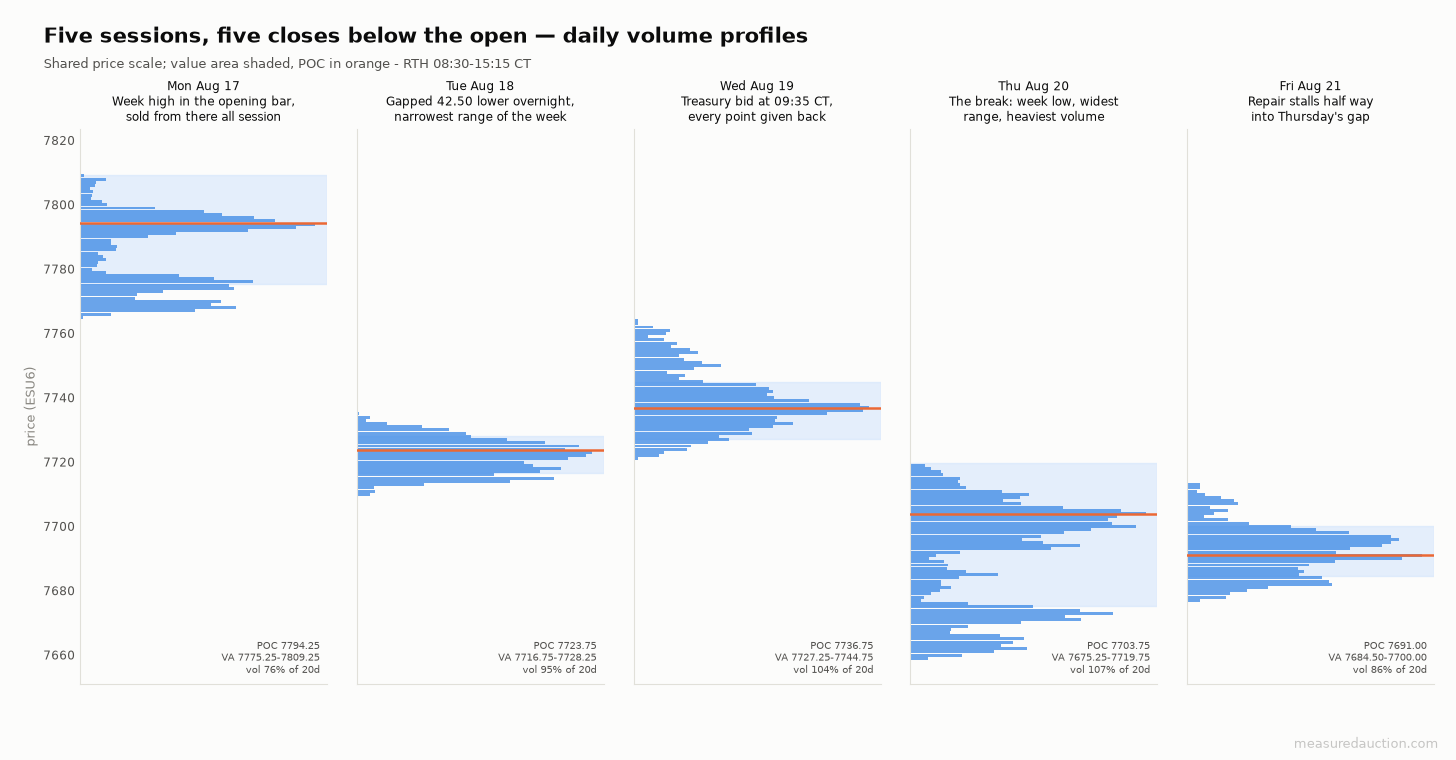
The shapes carry the week. Each distribution sits below the one before it, and only Wednesday's overlaps its predecessor to the upside.
Wednesday was the one attempt at repair. The Treasury said it would at least double its long-end buybacks, from $2 billion to $4 billion per operation, and the thirty-year yield fell from 5.26% toward 5.18% [8][9]. ES took the bid at 09:35 CT, running 7741.00 to 7752.75 inside a single five-minute bar, and reached 7764.75 at 10:00 CT. Every point of it came back. The session settled 7729.00 on regular-hours delta of negative 4,340, the heaviest net selling of the week, and on the first volume of the week above its twenty-day average.
Thursday broke it. Walmart fell 9% after US comparable sales missed, which set the open 31.00 points under Wednesday's settle [10][11]. Price rallied to 7720.00 at 10:00 CT and never traded above 7717.25 again. From 12:00 CT the auction distributed continuously, without one violent print behind it, and reached the week low 7659.00 at 14:55 CT. This was the widest range of the week at 61.00 points, on its heaviest volume, and it extended 32.75 points beyond its initial balance.
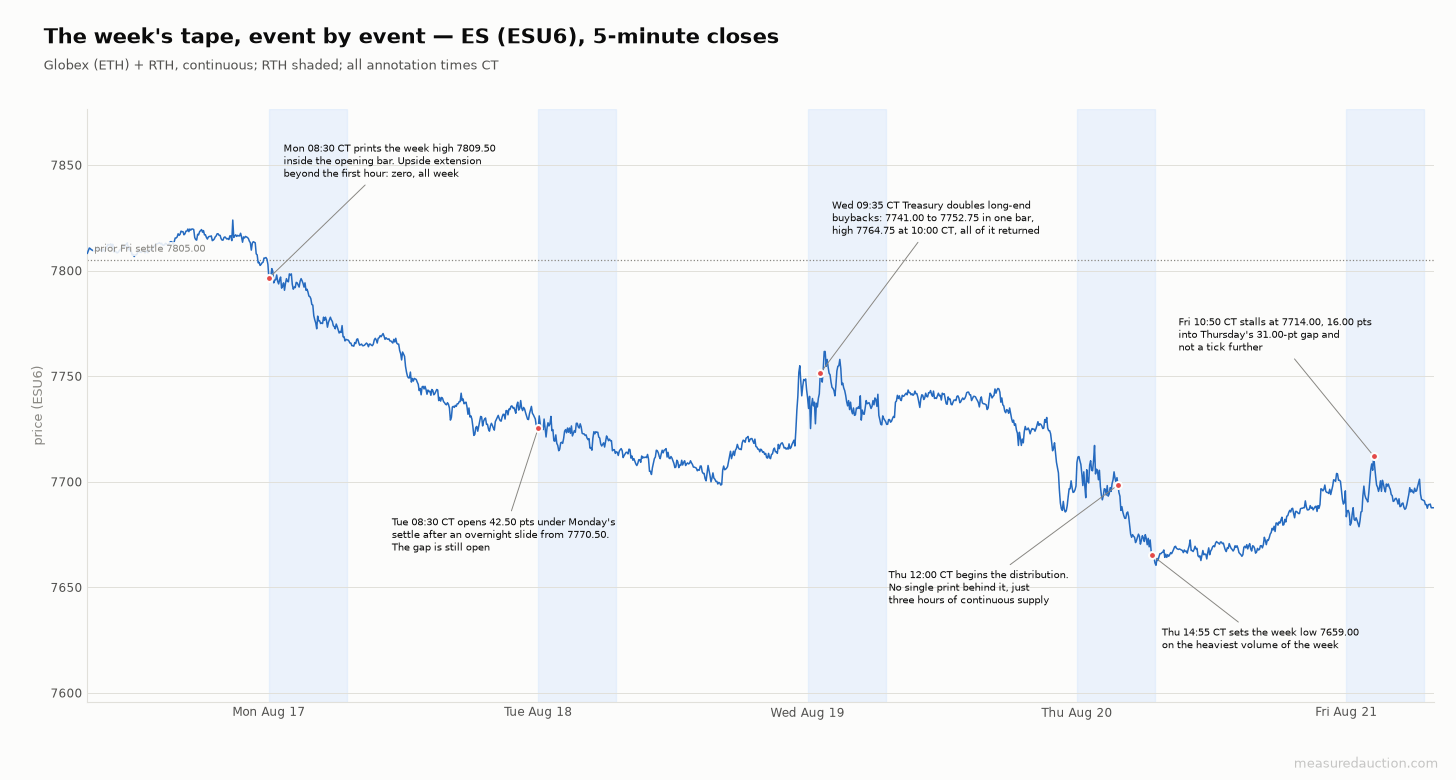
The whole week in one line. Three unfilled gaps step the market down, and Friday's recovery stops half way into the last of them.
Friday steadied. The open at 7695.75 came 33.25 points above Thursday's settle, price sold to 7676.75 by 08:50 CT, then bid through the morning to 7714.00 at 10:50 CT. That high is 16.00 points into Thursday's 31.00-point gap and no further. The session settled 7691.25 on the lightest volume since Monday, with regular-hours delta at positive 6,440, far the largest of the week.
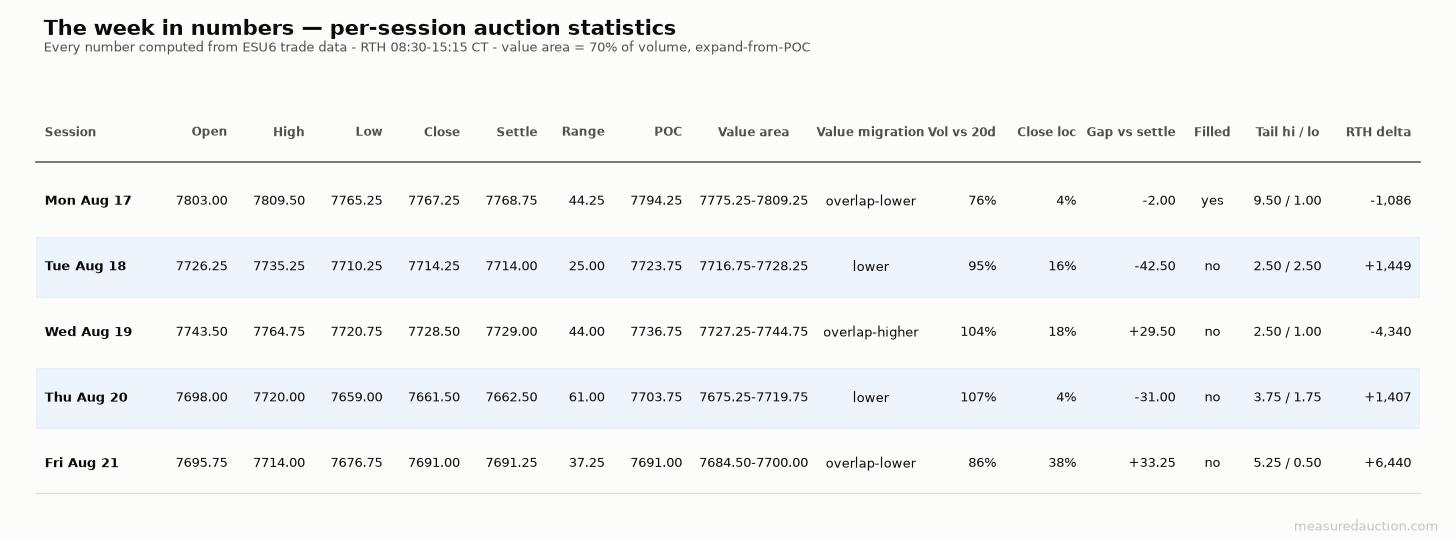
Every number computed from the completed week. Four sessions gapped and did not fill.
Two columns there deserve reading together. Add the five open-to-close moves and the regular sessions gave up 104.00 points, negative every single day. The five gaps swing far harder, from 42.50 points down on Tuesday to 33.25 up on Friday, and they net out at just 12.75 lower across the whole week. The overnight auction was loud and finished close to where it started. The cash session was quiet and did the damage.
Delta disagreed with price on three sessions. Tuesday and Thursday both settled sharply lower on positive delta, which means aggressive buyers were lifting offers the whole way down while sellers filled them without ever having to chase. Friday is the single session where positive delta and a higher settle agreed.
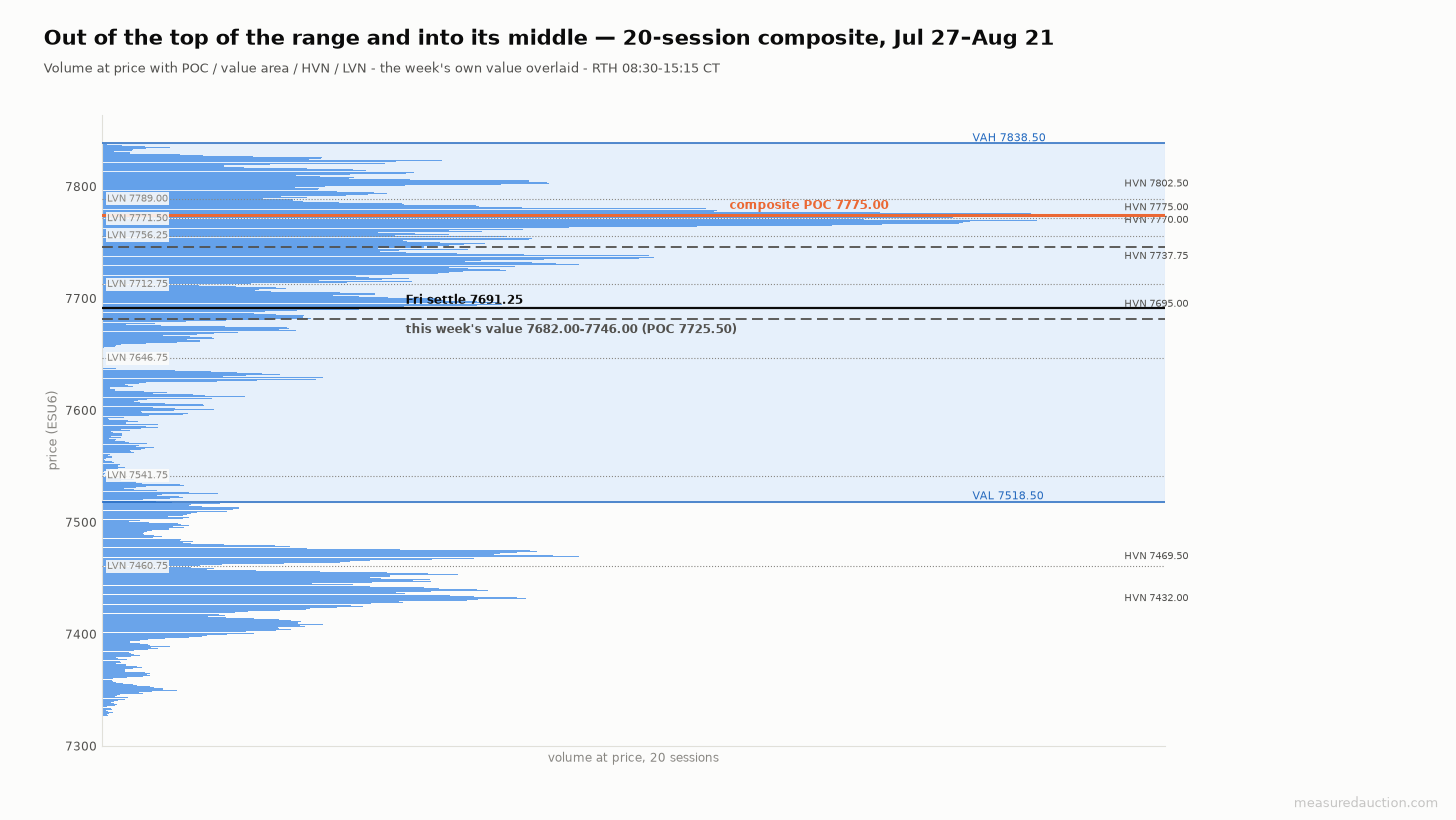
Twenty sessions of context. The week's value now sits underneath the composite point of control.
Where that leaves price matters more than the week's arithmetic. Friday's settle is 31.25 points below the ten-session value area low of 7722.50, so the market relocated out of the shelf it built in early August. The twenty-session composite reads calmer. Its value runs 7518.50 to 7838.50 with a control price of 7775.00, which puts Friday's settle inside a month of trade and 83.75 points under its fairest price. This was a relocation inside the range.
What broke and what got repaired
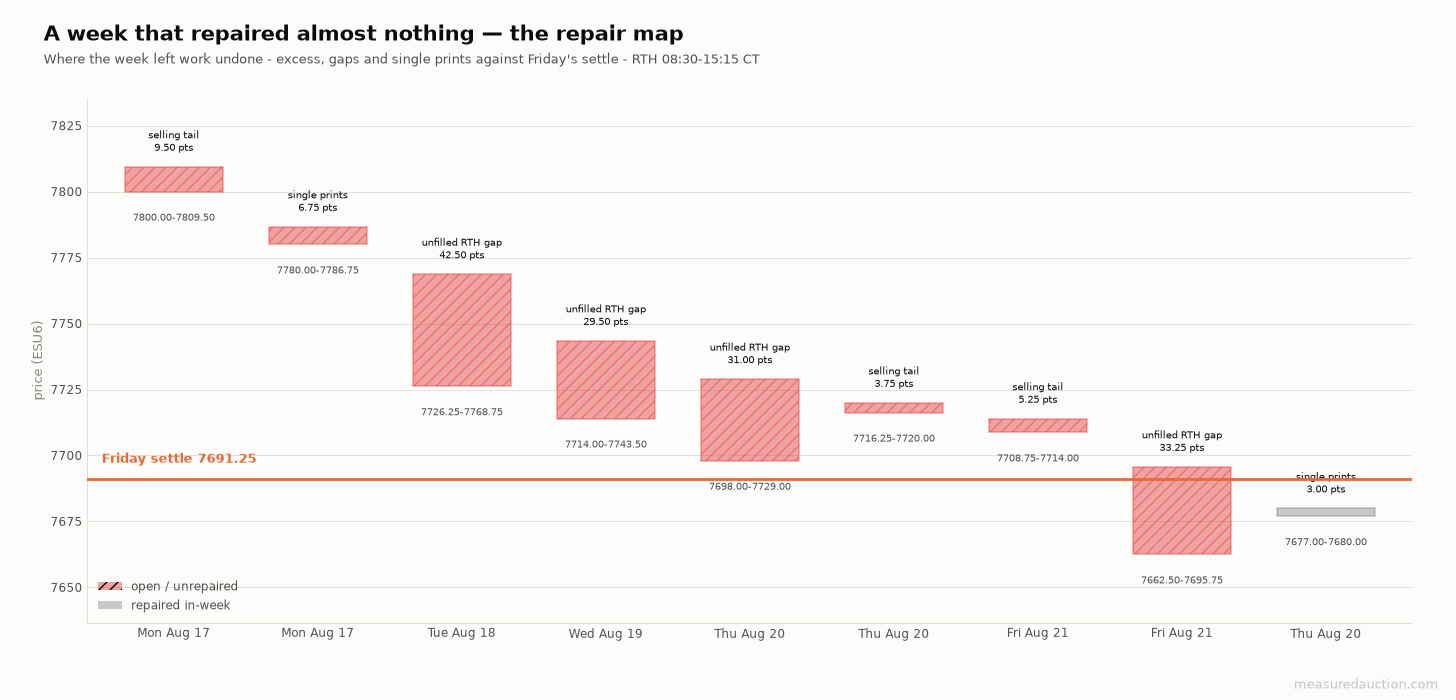
Every zone of excess or gap wide enough to matter, ranked by where it sits against Friday's settle. Hatched zones are still open.
The week repaired one thing. Thursday's single prints between 7677.00 and 7680.00, prices the auction passed through in a single bracket, were traded back through before Friday ended. Three points of work, out of everything the week left behind.
The gaps are the board. Tuesday's runs 7726.25 to 7768.75, Wednesday's 7714.00 to 7743.50, and Thursday's 7698.00 to 7729.00. They overlap into one continuous band from 7698.00 up to 7768.75, which is 70.75 points in which no session has yet traded back to the settle it gapped away from. The base of that band sits 6.75 points above Friday's settle.
Above it, Monday's rejection is still open: a 9.50-point selling tail between 7800.00 and 7809.50, excess that marks where the auction was refused, and single prints from 7780.00 to 7786.75. Beneath Friday's settle the work is lighter, one gap from 7662.50 to 7695.75 with the week low at 7659.00 under it. Everything overhead is unfinished and almost nothing below is.
What volatility did
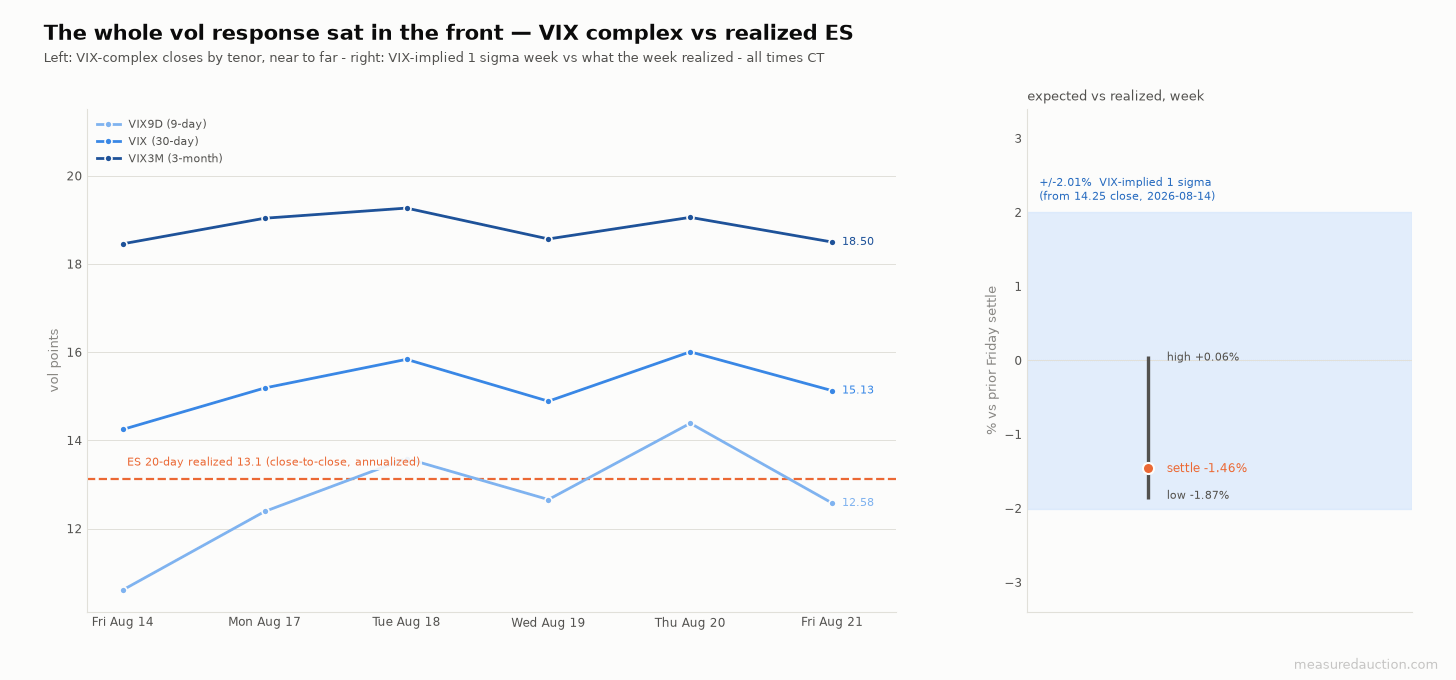
Left, the curve by tenor across the week. Right, the implied one-sigma week against what ES actually delivered.
The volatility response sat almost entirely in the front. Nine-day implied rose from 10.61 to 12.58 and closed Thursday at 14.39, its high for the week. Thirty-day VIX went from 14.25 to 15.13. Three-month VIX finished at 18.50 against 18.46 the prior Friday, which is no move at all [22]. A market repricing a regime lifts the back of the curve. This one lifted the front and left the back alone.
The curve held contango, near tenors below far ones, on all five sessions. Realized volatility in ES barely shifted either, from 13.48 on Monday to 13.13 on Friday on a twenty-day annualized basis.
That right panel is the week in one picture. The prior Friday's VIX close of 14.25 implied a one-sigma week of plus or minus 2.01%. ES delivered a high 0.06% above that settle and a low 1.87% below it, finishing down 1.46%. The entire path stayed inside the band. A week that travelled 113.75 points in one direction still finished inside what had been priced for it. One caveat belongs on that comparison: the implied leg is VIX, which prices S&P 500 cash options and not ES futures options, scaled to a week. There is no way to recover what the ES weekly straddle itself cost on August 14.
The week ahead
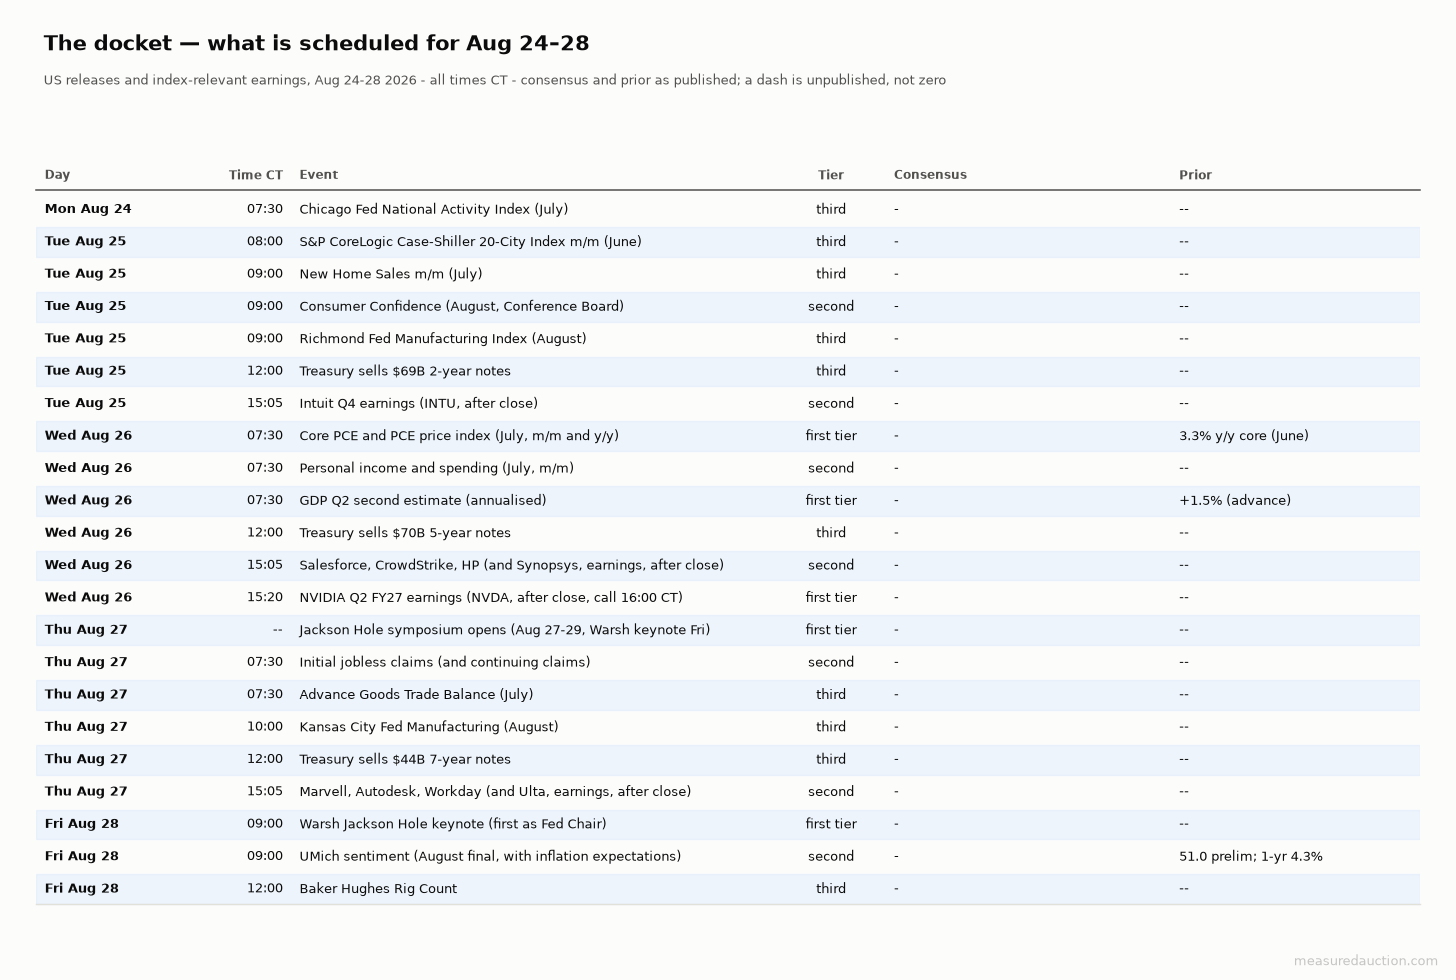
The docket. Consensus cells are blank because they were unpublished when I built this, which is not the same as zero.
Wednesday is the week. Core PCE for July and the second estimate of second-quarter GDP both land at 07:30 CT [16][17]. Core PCE ran 3.3% on the year in June, and it is the inflation series the Fed weighs most heavily ahead of September. Nvidia then reports after the close at roughly 15:20 CT, with its call at 16:00 CT [19]. Three first-tier events inside nine hours, on a market whose entire repair band sits overhead.
Friday is the other one. The Jackson Hole symposium runs August 27 to 29, and Kevin Warsh gives the keynote at 09:00 CT on Friday August 28, his first as Chair [18][20].
The front of the week carries almost nothing. Consumer confidence at 09:00 CT on Tuesday is the only second-tier economic release before Wednesday, which leaves two sessions of positioning ahead of the data [17]. The Treasury also auctions two-, five- and seven-year notes across those same sessions [17]. After a week the long end drove, those results carry more than their usual weight.
What the options market pays for
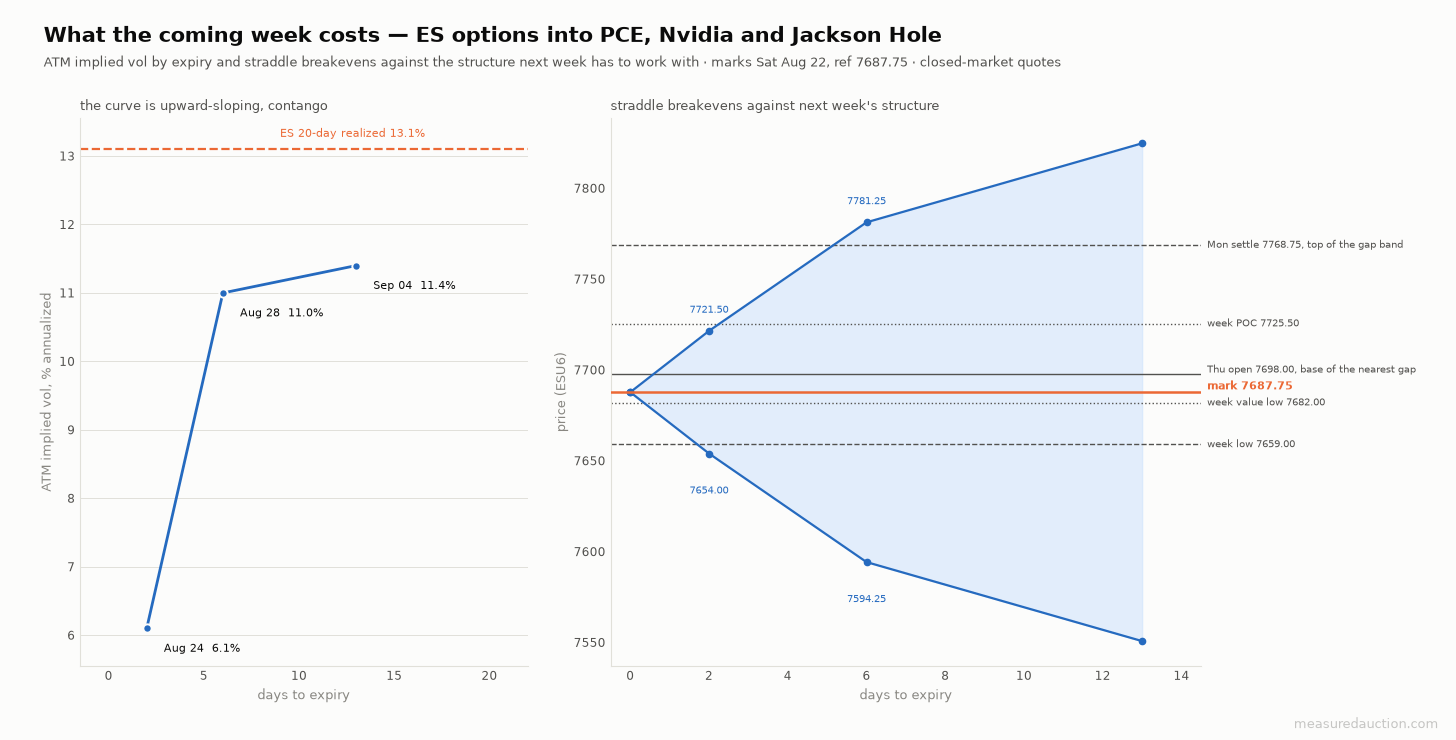
The implied curve slopes up from front to back. Breakevens are drawn from a Saturday mark of 7687.75.
A caveat comes first. I took this surface on Saturday with the market closed, so every quote is a Friday carry. The front expiry, August 24, prints 6.1% at-the-money implied volatility across two calendar days that contain a weekend. That is an artifact of counting calendar days instead of trading hours, and it is not a signal.
The August 28 expiry is the one to read. Its straddle costs 93.50 points, setting breakevens at 7594.25 and 7781.25 against the mark, at 11.0% implied volatility. Thirty-day implied prints 11.84% against twenty-day realized of 13.13%, a ratio of 0.90. The whole visible curve is priced under what ES has been delivering.
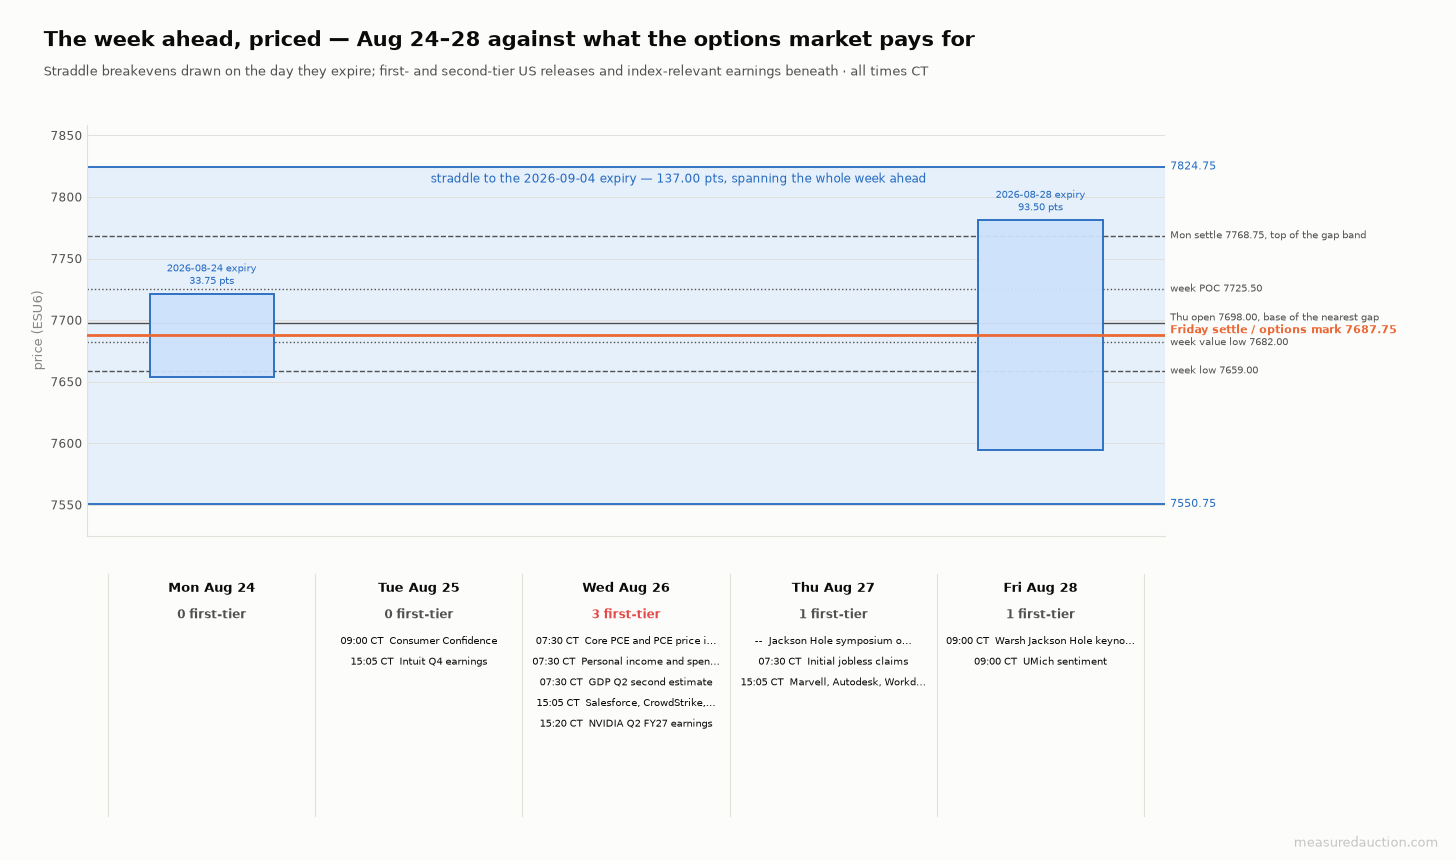
What is priced against what is structural. The wide band spanning the week is the September 4 expiry.
Read those breakevens against the repair map and the week's shape appears. The upper breakeven, 7781.25, sits 12.50 points above the top of the unrepaired band at 7768.75. A move that closes every gap the week left takes price almost exactly to what the straddle costs. The lower breakeven, 7594.25, is 64.75 points beneath the week low, at a price ES has not traded since August 3.
The straddle is symmetric by construction. The structure it is drawn against is not. Its upper edge lands on the top of the repair band, and its lower edge lands below everything the market has traded in fourteen sessions.
The read
The week sold every cash session and then stopped selling. Friday gave up 4.75 points between its open and its close, against 36.50 on Thursday and 35.75 on Monday. It did that on the largest positive delta of the week, the only session of the five where aggressive buying and a higher settle lined up. The nearest unfinished business, the base of Thursday's gap at 7698.00, sits 6.75 points above Friday's settle, and Friday already traded 16.00 points into it.
What the distribution favours is a probe up into that band early in the week, before Wednesday's data. The week's control price at 7725.50 sits inside it, which gives the move a destination rather than only a direction. Two quiet sessions ahead of Wednesday is the kind of calendar that lets a market repair instead of trend.
The selling was never aggressive: delta ran positive on both of the week's largest down days. That means the decline came from offers being withdrawn rather than from buyers being overwhelmed. That is the mechanism behind four unfilled gaps in five sessions.
I want to be precise about what this lean is not. It is not a view that the decline has ended. Value migrated lower or overlapped lower in four of the five sessions, and nothing Friday did reclaimed the ten-session value area low at 7722.50. The lean is for repair inside a broken structure, and it expires when Wednesday's data lands.
What would change the read
A trade below 7659.00 ends it. That is the week low, 32.25 points under Friday's settle, with only the 7662.50 to 7695.75 gap between the two. Losing it would say the market chose to extend the decline instead of repairing it. The next reference underneath is the September 4 straddle's lower breakeven at 7550.75.
The read also fails upward, which costs less but is worth naming. Acceptance above 7768.75 would finish the whole week's outstanding work in one move. By acceptance I mean a session that builds its value area beyond the top of the repair band, not a probe through it. At that point the lean has already paid, and the question becomes whether Monday's rejection at 7809.50 still holds.
References
S&P 500 falls for a third day, as elevated global bond yields and oil prices weigh on market, CNBC
How major US stock indexes fared Monday 8/17/2026, Associated Press via Yahoo Finance
How major US stock indexes fared Tuesday 8/18/2026, Associated Press via Barchart
Dow closes 110 points lower as bond yields rise and semiconductor stocks slide, Invezz
How major US stock indexes fared Wednesday 8/19/2026, Associated Press via ABC News
How major US stock indexes fared Thursday 8/20/2026, Associated Press via Yahoo Finance
Walmart stock tumbles 9% after outlook disappoints Wall Street, CNBC
Dow tumbles 700 points, S&P 500 falls as Treasury plan to subdue yields fails, CNBC
Dow surges 500 points Friday, but index posts back-to-back weekly losses, CNBC
Week Ahead: Economic Indicators 24th to 28th August (US), FinancialJuice
FED: Chair Warsh To Give Jackson Hole Keynote Speech Aug 28 At 10am ET, MNI Markets
Nvidia schedules Q2 fiscal 2027 earnings call for Aug. 26, Investing.com
Forex Economic Calendar Overview: Key Events for 24.08.2026 to 30.08.2026, LiteFinance
This recap and outlook is educational market commentary, not investment advice or a recommendation. It does not consider any reader's financial situation, objectives, or risk tolerance, and past patterns described here are not a guarantee of future results. All levels are computed from the completed week. Futures and options trading carries substantial risk of loss and is not suitable for every investor.