ES Futures Recap & Week Ahead · Aug 17–21, 2026
ES gained 25.25 points in a 100.5-point week and sold aggressively every session on the way up. Next week, the July minutes land.

ES gained ground last week without a single session where buyers were the aggressive side. The contract settled Friday at 7805.00, up 25.25 points on the prior Friday's 7779.75, a move of 0.32%. All of it fit inside 100.5 points, 7738.00 up to 7838.50, which is 1.29% of where it started. Underneath that quiet arithmetic, regular-hours delta came in negative on all five sessions.
All profiles here are regular-session only, 09:30 to 16:15 ET. The overnight Globex session enters as inventory, positions accumulated outside regular hours, and as gap context. Times throughout are ET.
The week in profile
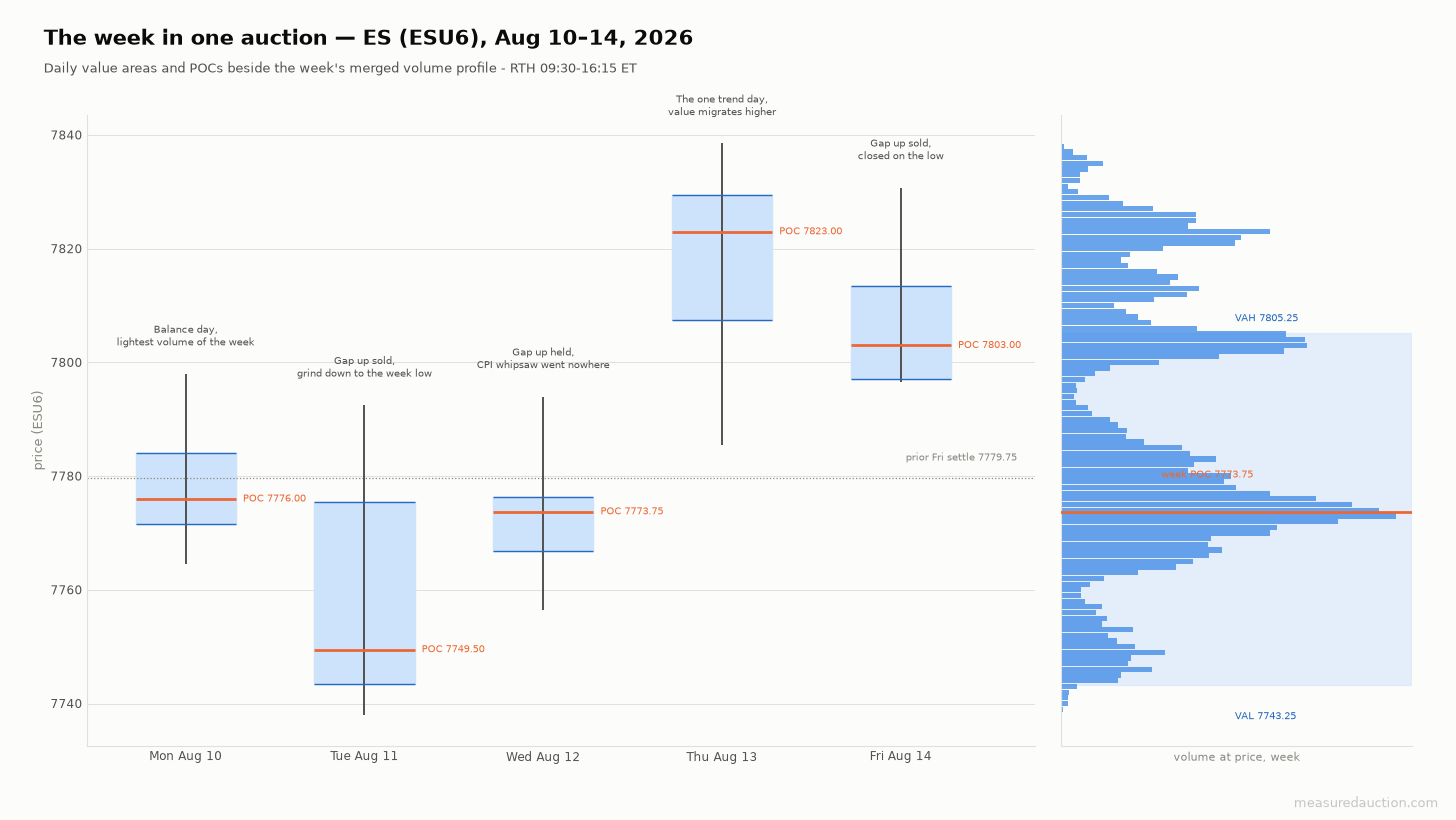
Five sessions on one scale. The week built its value between 7743.25 and 7805.25, with the point of control, the price that traded the most volume, at 7773.75. Friday settled at the very top of that band.
Monday did the least of any session. Price opened 6.75 points under Friday's settle, filled that gap during the morning, and spent the day rotating between 7764.50 and 7798.00. Volume ran at 64.4% of the twenty-day average, the lightest session of the week. Oil rose on uncertainty about when the Strait of Hormuz reopens, which fed rate worries, and Intel led semiconductors lower [1][2]. Value overlapped higher and settled 7776.75.
Tuesday gapped up 15.00 points and gave it all back. The gap filled inside the first hour, then price ground lower from mid-morning to the week low, 7738.00, at 14:25. There was no print behind it. Mega-cap technology and the cloud names were sold ahead of Wednesday's inflation report while energy outperformed [3][4]. The session extended 33.75 points below its initial balance, the first hour's range, and never once traded above it. Regular-hours delta was negative 12,722.
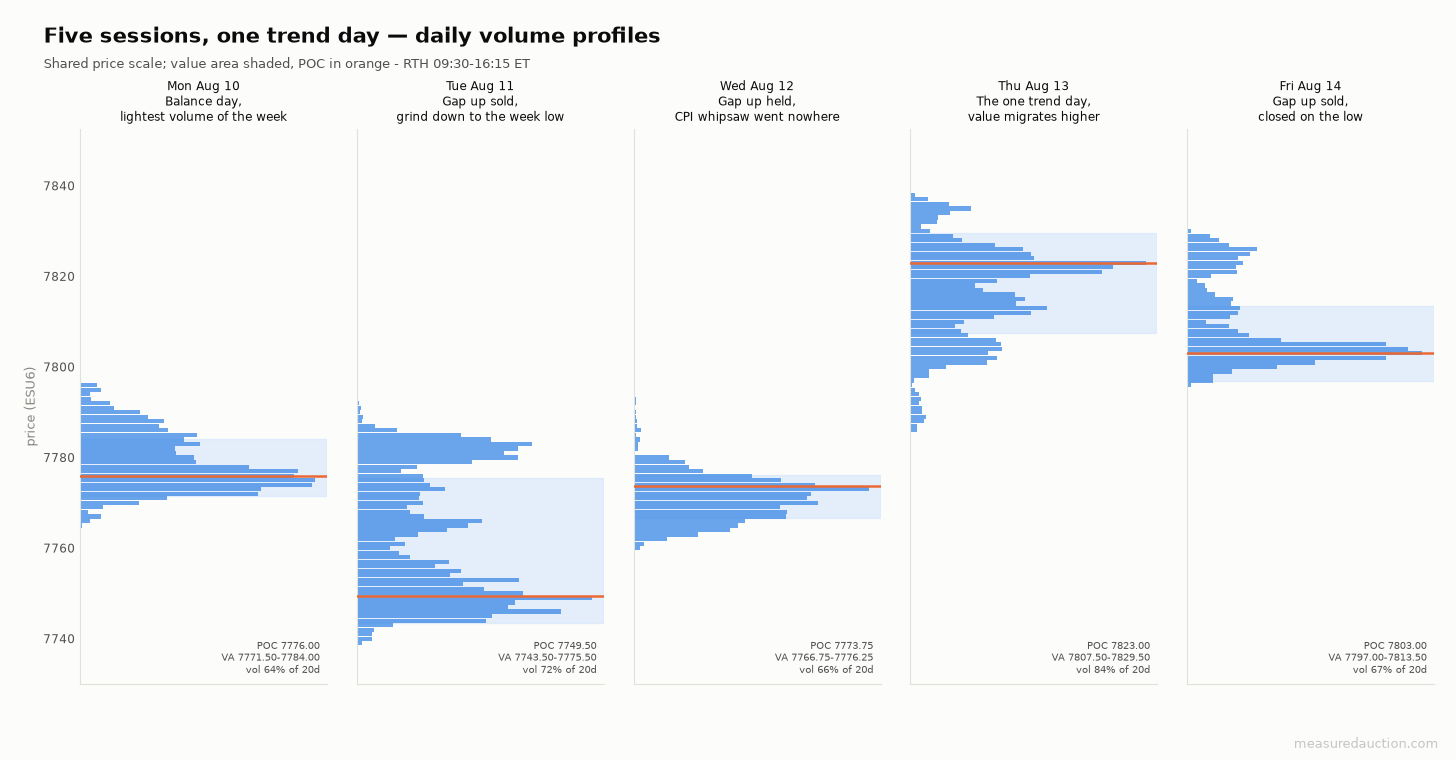
The shapes carry the week. Monday, Tuesday and Wednesday build fat, centered distributions that overlap each other heavily. Only Thursday elongates and moves its value clear of the day before.
Wednesday is where the week's most interesting five minutes sat. July CPI printed at 08:30, up 0.1% on the month and 3.4% on the year, down from 3.5%, with core up 0.2% [5][6]. The 08:30 bar traded a 27.25-point range on 12,651 contracts. It closed within 1.25 points of where it opened. An auction that goes both ways and resolves nothing is a fair description of the whole week. The regular open then sold twenty points inside the first bar, yet the 44.25-point gap over Tuesday's settle never filled.
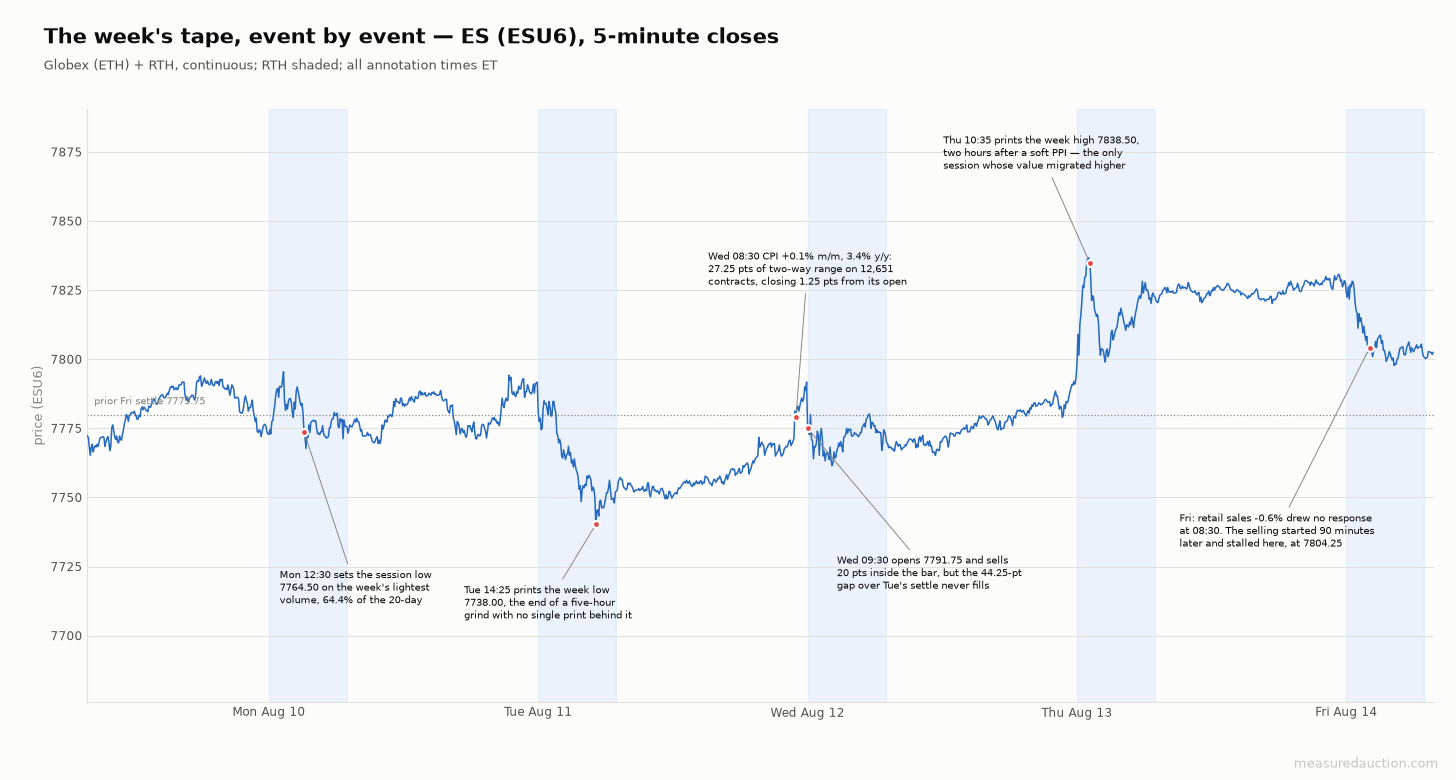
The whole week in one line. Three sessions of chop, one clean push on Thursday morning, then a Friday that leaked lower from mid-morning and flatlined for four hours.
Thursday was the only session that behaved like a trend. PPI came in unchanged against 0.2% expected, and the annual rate eased to 4.7% from 5.5% [7][8]. The print itself moved price 12.25 points. Its real leg developed over the following two hours, and the week high, 7838.50, came at 10:35. This was the widest initial balance of the week at 51.5 points, and price extended only 1.50 points beyond it. Delta finished at negative 109, the flattest reading of the week, on the heaviest volume of the week. It is the one session whose value migrated cleanly higher rather than overlapping.
Friday sold a soft consumer number that it had ignored at the time. July retail sales fell 0.6% against expectations of a small rise, the biggest monthly drop in over a year [9]. The 08:30 bar carried 2,804 contracts and no unusual range, which is to say the tape did not respond. Selling began roughly ninety minutes later and carried price down to 7804.25 by 11:30, where it stalled for four hours. The session closed at 12.4% of its range on delta of negative 15,750, the heaviest net selling of the week.
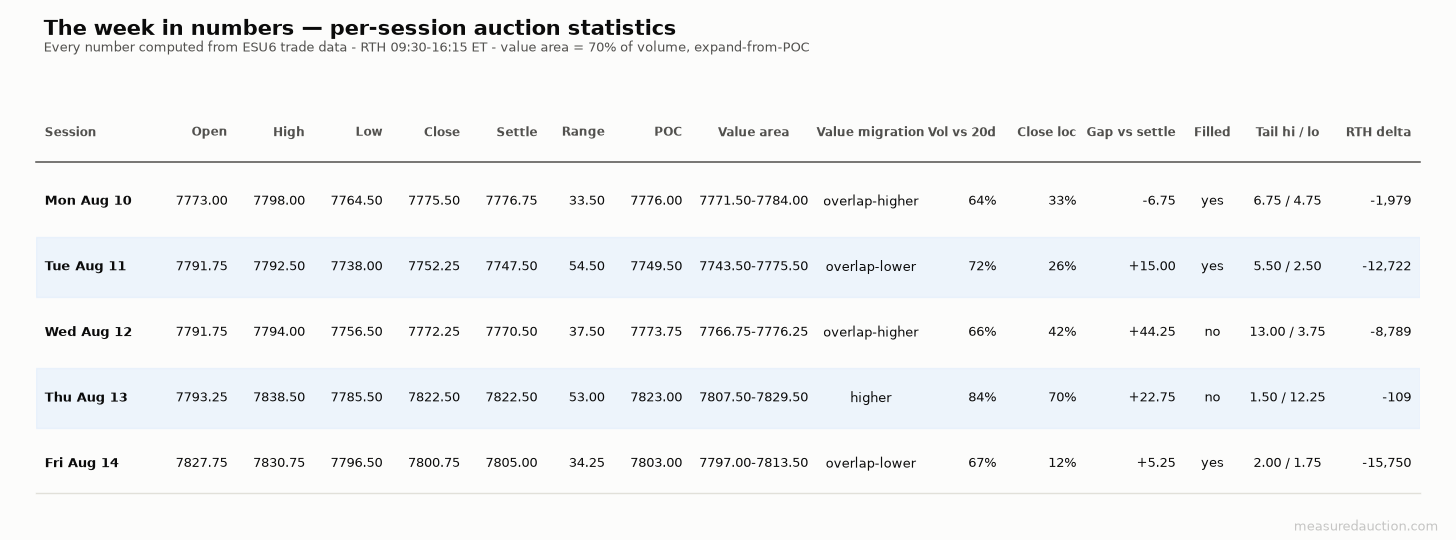
Every session traded under its twenty-day average volume. The delta column is negative five times out of five.
That last point deserves its own sentence. Aggressive sellers hit bids in every session of a week that closed higher, which means passive buyers absorbed all of it without ever having to chase. Absorption of that kind is size working patiently, not a market running out of buyers. It also means nothing above has been paid for with urgency.
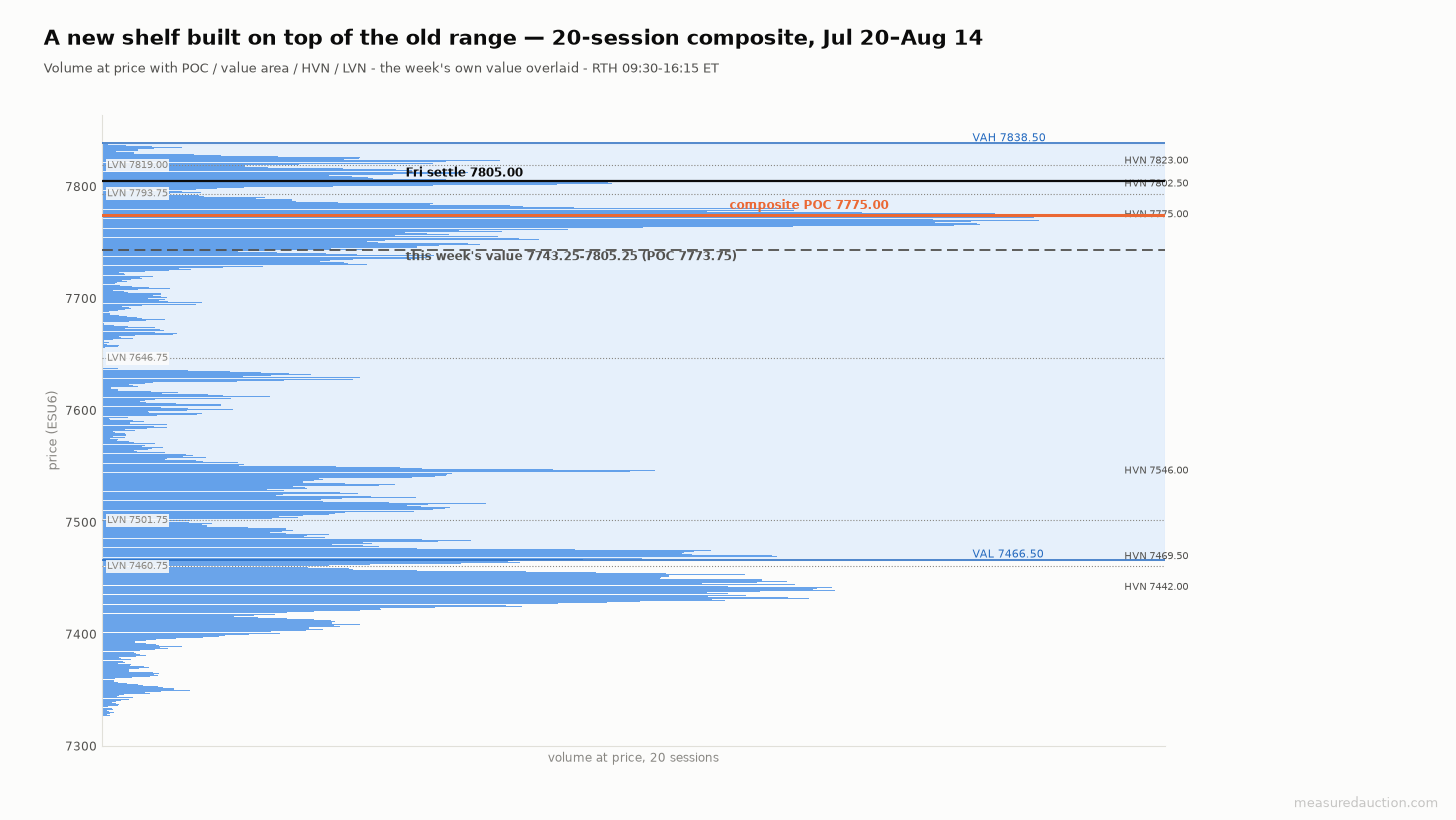
Twenty sessions of context. The week's entire range sits in the top fifth of a composite whose value runs all the way down to 7466.50, and it sits directly on the composite's point of control.
The week parked itself on the twenty-session point of control at 7775.00, which is within 1.25 points of its own weekly control price. That is a market that has found the fairest price in a month of trade and is sitting on it. The composite's value area high, 7838.50, is also the week high. Nothing has traded above that in twenty sessions.
What broke and what got repaired
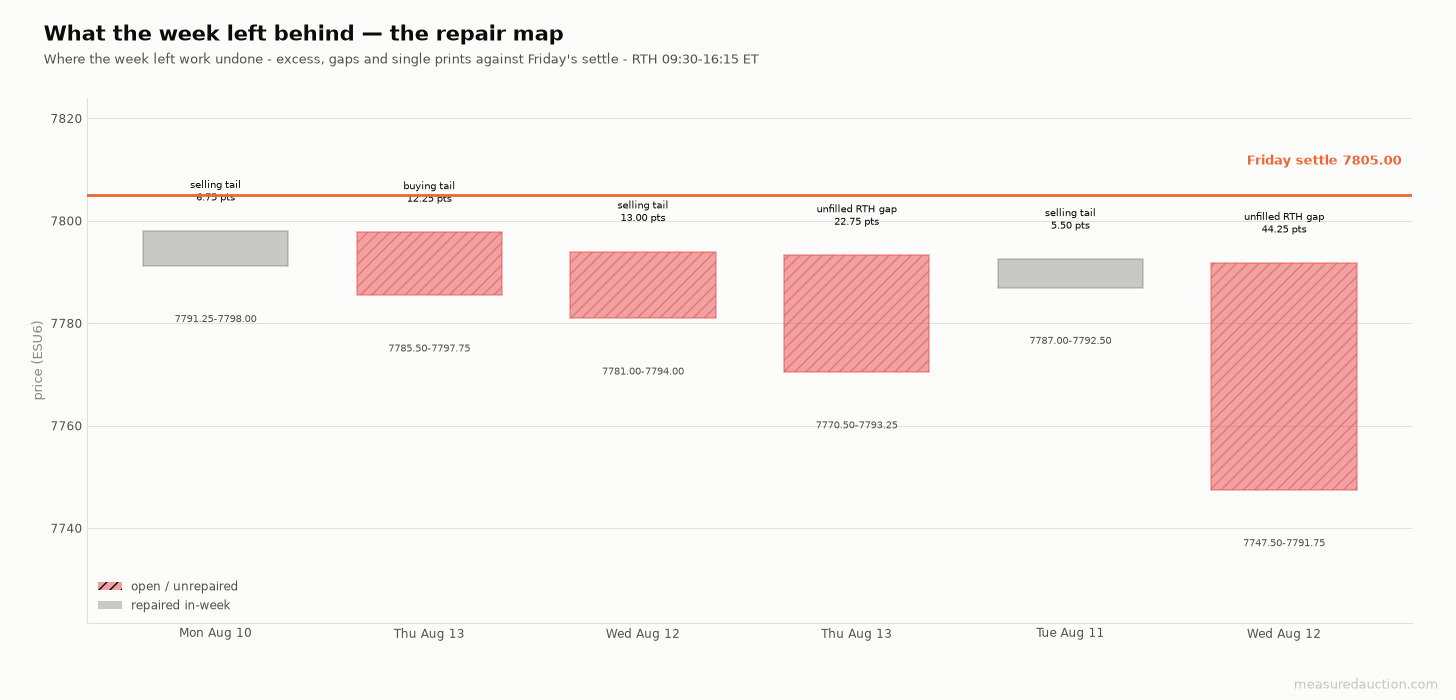
Every zone of excess or gap wide enough to matter, ranked by where it sits against Friday's settle. Hatched zones are still open.
The week repaired three small tails, two of them wide enough to show on the map above, and left the two things that matter untouched. Wednesday's gap, from 7747.50 to 7791.75, is the largest piece of unfinished business on the board at 44.25 points. Thursday's gap, 7770.50 to 7793.25, overlaps its upper half. Between them they leave one continuous stretch from 7747.50 to 7793.25, 45.75 points that the market moved through without auctioning properly.
Above, the work is thinner but real. Thursday's high left a 1.50-point selling tail at 7837.00 to 7838.50, excess that marks where the auction was rejected. Friday left single prints, prices the auction passed through in one bracket and never returned to, at 7817.75 to 7819.00, and a 2.00-point selling tail under 7830.75. None of it is repaired. The asymmetry is the point: 45.75 points of unfilled gap below, a handful of ticks of rejection above.
What volatility did
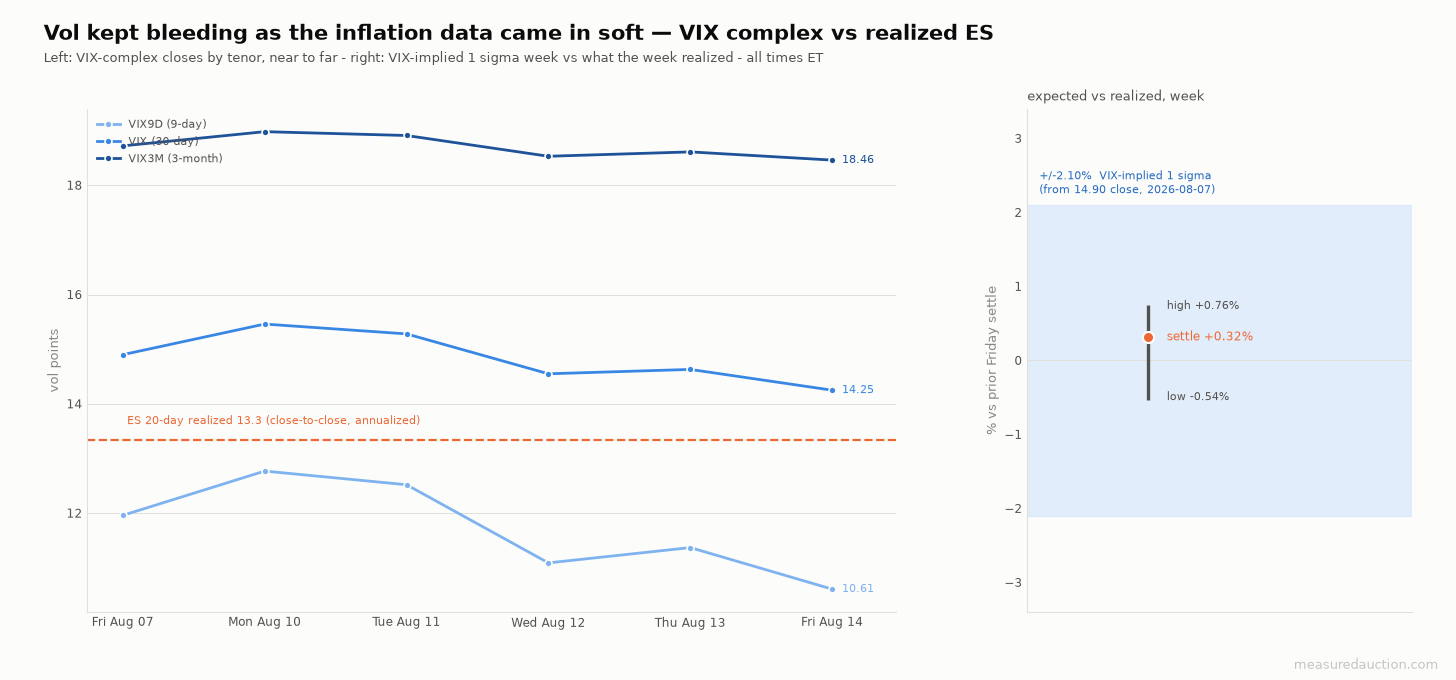
Left, the volatility curve fell across all three tenors as the inflation prints landed soft. Right, the week realized a fraction of what was priced into it.
Front-month VIX closed the week at 14.25, down from 14.90 the prior Friday. The nine-day measure did the real work, sliding from 11.96 to 10.61. Three-month volatility barely moved, ending at 18.46. The curve stayed in contango, near tenors below far ones, all five sessions.
That right panel is the trade of the week for anyone selling premium. The prior Friday's VIX close implied a one-sigma week of plus or minus 2.10%. ES delivered a high of 0.76% and a low of 0.54% against that settle, finishing up 0.32%. Its full high-to-low travel came to 1.29%, against an implied one sigma of 2.10% in each direction. One caveat belongs on that comparison: the implied leg is VIX, which prices S&P 500 cash options rather than ES futures options, scaled to a week. There is no way to recover what the ES weekly straddle itself cost on August 7, so the comparison is close but not exact.
Realized volatility in ES fell through the week too, from 13.96 to 13.33 on a twenty-day annualized basis. Nine-day implied volatility sat below that mark every session of the week.
The week ahead
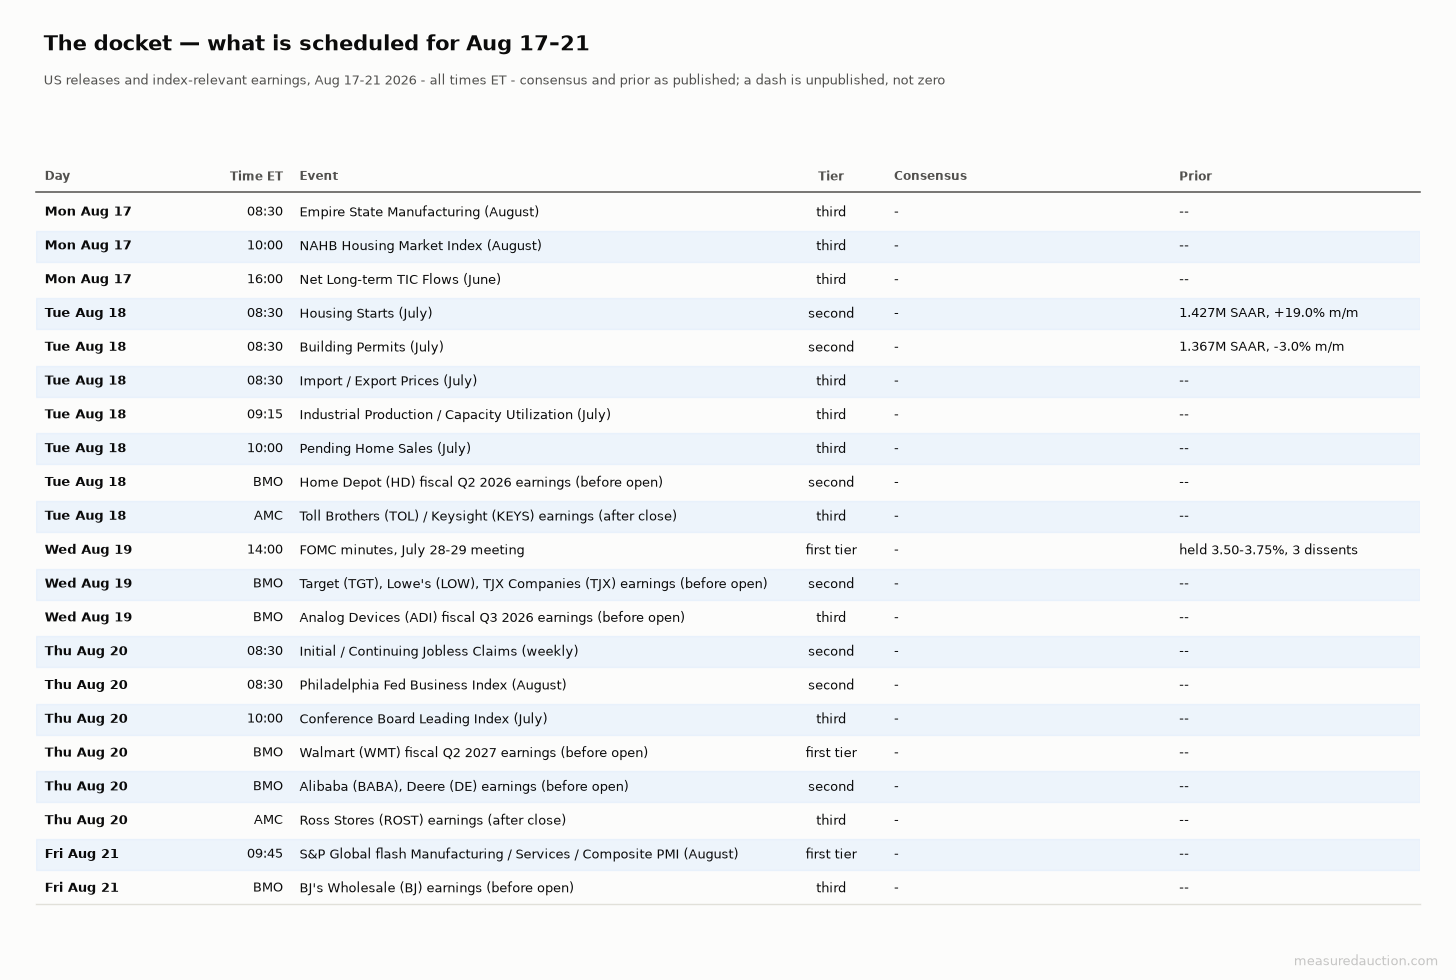
The docket. Consensus cells are blank because they were unpublished when I built this, which is not the same as zero.
Wednesday at 14:00 is the week. The July FOMC minutes cover a meeting where the committee held at 3.50% to 3.75% and three members dissented in favor of a 25 basis point increase [13][14]. That is the sharpest split on the committee since 2016 [14]. The CPI print has since pulled September hike odds down to around 42%, and the softer PPI number that followed eased them further [5][7]. Wednesday's release records how close the hawkish bloc came to carrying the room before that data existed, and the market has no way to price that in advance.
Consumer demand is the other thread. Home Depot reports Tuesday before the open, Target and Lowe's Wednesday, Walmart Thursday [12][15]. They arrive four days after a retail sales print that fell 0.6%. Housing starts and building permits land Tuesday at 08:30, against a June that jumped 19.0% to 1.427 million annualized [17]. Friday brings the August flash purchasing managers' surveys at 09:45.
One thing that is not on the docket: the Jackson Hole symposium runs August 27 to 29 this year, so it sits a full week beyond this letter [16].
What the options market pays for
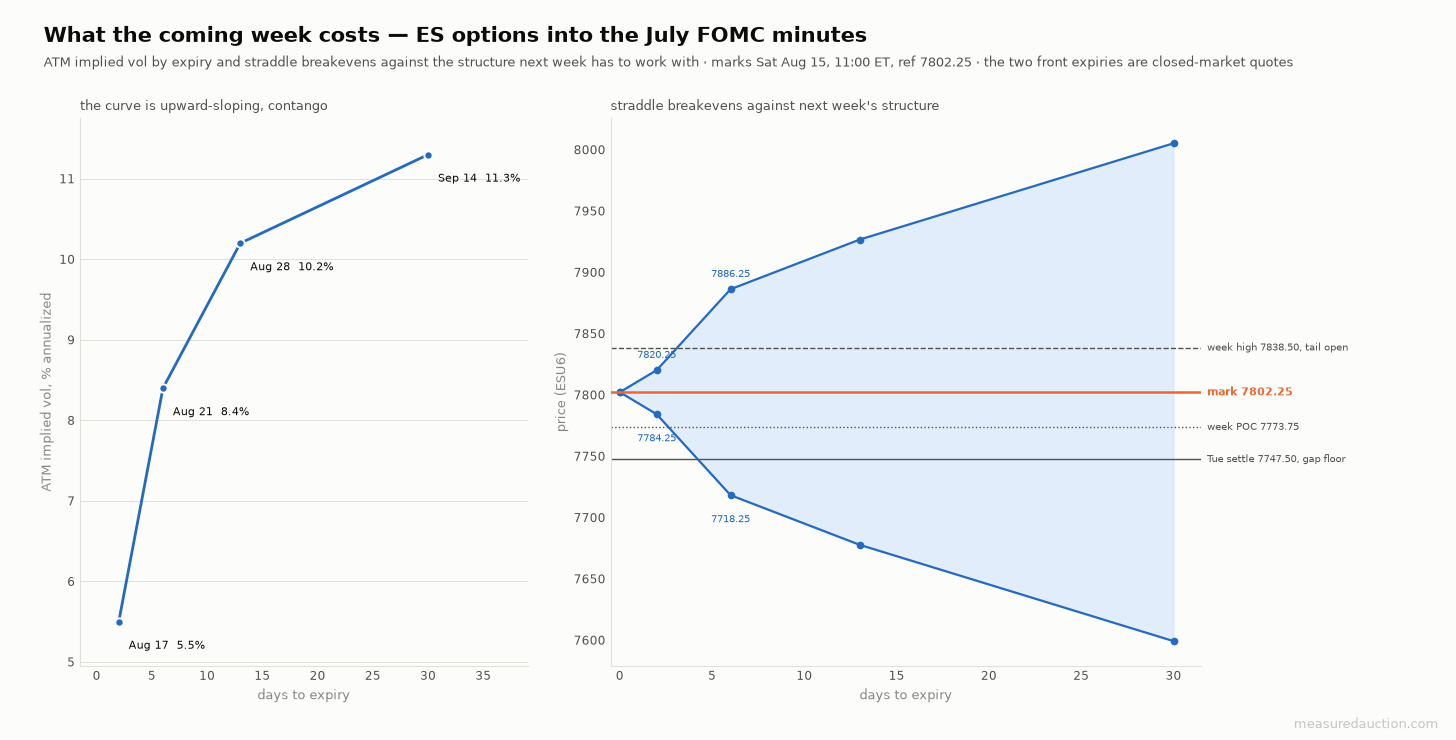
The implied curve slopes up from front to back. Breakevens are drawn from a Saturday mark of 7802.25.
A caveat has to come first, because two of these expiries cannot be read. I captured this surface on Saturday with the market shut. The August 17 contract quotes its at-the-money call 0.50 bid at 19.00 offered, and the August 21 call 20.00 at 60.25. In both cases the spread is wider than the straddle those quotes imply, so the mid prices carry no information. The August 28 expiry quotes its call 62.75 at 64.00 and its put 60.50 at 61.75. That one is tight enough to trust, and it is what I read.
Its straddle costs 124.50 points, which sets breakevens at 7677.75 and 7926.75 against the mark. Implied volatility there is 10.2% annualized. The thirty-day tenor prints 11.3%. Against twenty-day realized volatility of 13.3%, the entire visible curve is priced under what ES has actually been delivering, at a ratio of 0.84. That is unusual, and it follows a week whose realized range was tiny. Options are cheap relative to recent history precisely because recent history is the four weeks that included the prior week's large move.
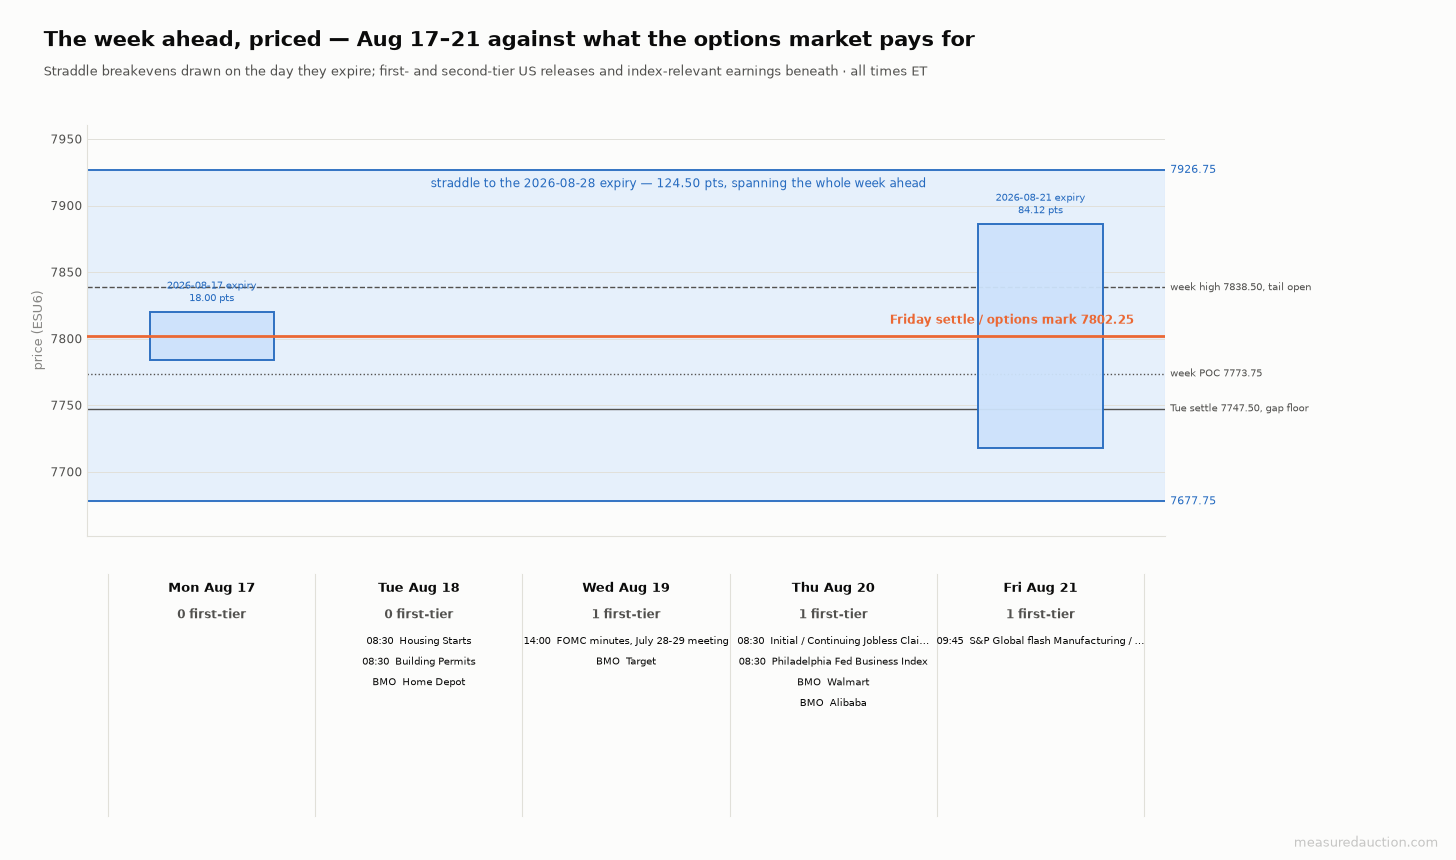
What is priced against what is structural. The wide band spanning the week is the August 28 expiry.
The August 28 breakevens straddle every level that matters. Its upper edge, 7926.75, sits 88.25 points above the week high. The lower edge, 7677.75, sits 69.75 points under Tuesday's settle at 7747.50, which is the floor of Wednesday's unfilled gap. In other words the surface is not pricing a test of any specific structure. It is pricing a fortnight of ordinary drift.
The read
The week left a market sitting on the fairest price of the last month with all of its unfinished work underneath it. Friday settled 7805.00, which is 0.25 points under its own weekly value area high, after closing at 12.4% of the session range on the heaviest selling of the week. Value migrated higher exactly once in five sessions. The profile argues for a rotation back into the 7770.50 to 7793.25 gap before this shelf resolves higher, with the week's control price at 7773.75 as the magnet.
The reasoning is the delta. Five sessions of net aggressive selling into a market that closed higher means the advance was built on absorption rather than on initiative buying, aggressive orders paying up to get filled. Absorption holds price until it does not, and it leaves no committed longs above to defend the highs. Beneath sits 45.75 points of gap the market has never properly auctioned.
I want to be precise about what that lean is not. It is not a call for the highs to fail. Thursday's push was clean, it migrated value, and it did so on the week's only flat delta reading. If the minutes land dovish on Wednesday, this shelf is well placed to leave.
What would change the read
Acceptance above 7838.50 ends it. By acceptance I mean time spent trading beyond a level rather than a probe through it: specifically a session that builds its value area above 7805.25 and settles above the week high. That would confirm the absorption was accumulation and turn the twenty-session value area high into support.
The read also fails from the other direction, and that matters more. A settle below 7743.25, the week's value area low, would fill Wednesday's gap outright and put price under the whole week's value. At that point, the rotation described above has already happened, and the question becomes whether the July FOMC minutes have reopened a hawkish path the market spent two inflation prints closing.
References
1. [Stock Market Today (Aug. 10, 2026): Energy, oil prices rise amid fresh concerns over potential Middle East deal, TheStreet](https://www.thestreet.com/stock-market-today/stock-market-today-dow-jones-sp-500-nasdaq-updates-aug-10-2026)
2. [S&P 500 closes little changed as oil rises on Iran uncertainty, Intel leads chips lower, CNBC](https://www.cnbc.com/2026/08/09/stock-market-today-live-updates.html)
3. [Dow, S&P 500, Nasdaq slip amid US-Iran impasse, Alphabet stock sinks, Yahoo Finance](https://finance.yahoo.com/markets/live/stock-market-today-tuesday-august-11-dow-sp-500-nasdaq-102827503.html)
4. [How major US stock indexes fared Tuesday 8/11/2026, The Washington Post](https://www.washingtonpost.com/business/2026/08/11/wall-street-stocks-dow-nasdaq/cd13af98-95c1-11f1-9ef9-1be722184483_story.html)
5. [CPI inflation report July 2026: Prices rose 0.1%, annual rate 3.4%, CNBC](https://www.cnbc.com/2026/08/12/cpi-inflation-report-july-2026.html)
6. [July 2026 CPI report: Inflation remained stubborn, NBC News](https://www.nbcnews.com/business/economy/cpi-inflation-july-2026-rcna591698)
7. [Wholesale prices were flat in July, below expectations for 0.2% increase, CNBC](https://www.cnbc.com/2026/08/13/wholesale-prices-were-flat-in-july-below-expectations-for-0point2percent-increase.html)
8. [S&P 500 notches record high, Nasdaq rallies after soft inflation data, Yahoo Finance](https://finance.yahoo.com/markets/live/stock-market-today-thursday-august-13-sp-500-record-high-nasdaq-dow-inflation-100145282.html)
9. [July retail sales notch biggest drop in more than a year, The Washington Post](https://www.washingtonpost.com/business/2026/08/14/july-retail-sales-notch-biggest-drop-more-than-year/)
10. [S&P 500 slips from record high but caps third straight week of gains, Yahoo Finance](https://finance.yahoo.com/markets/live/stock-market-today-friday-august-14-dow-sp-500-nasdaq-102635519.html)
11. [Weekly US Market Review, August 10–14, 2026, HDFCSky](https://hdfcsky.com/news/weekly-us-market-review-august-10-14-2026-sp-500-notches-third-weekly-gain-as-cooling-inflation-and-tech-rally-offset-oil-jitters)
12. [Weekly Event Calendar: 08/17/2026 to 08/21/2026, Investrade](https://investrade.com/weekly-event-calendar-08-17-2026-08-21-2026/)
13. [FOMC meeting calendars and information, Federal Reserve](https://www.federalreserve.gov/monetarypolicy/fomccalendars.htm)
14. [Key economic events for 17.08.2026 to 23.08.2026, LiteFinance](https://www.litefinance.org/blog/analysts-opinions/weekly-economic-calendar-for-17082026-23082026/)
15. [Retail earnings next week could shed light on the health of consumer spending, CNBC](https://www.cnbc.com/2026/08/14/stock-market-next-week-outlook-for-aug-17-21-2026.html)
16. [About the Jackson Hole Economic Policy Symposium, Federal Reserve Bank of Kansas City](https://www.kansascityfed.org/research/jackson-hole-economic-symposium/about-jackson-hole-economic-symposium/)
17. [New Residential Construction, June 2026, US Census Bureau](https://www.census.gov/construction/nrc/pdf/newresconst.pdf)
18. [Cboe VIX, VIX9D and VIX3M daily price history](https://www.cboe.com/tradable_products/vix/vix_historical_data/)
This recap and outlook is educational market commentary, not investment advice or a recommendation. It does not consider any reader's financial situation, objectives, or risk tolerance, and past patterns described here are not a guarantee of future results. All levels are computed from the completed week. Futures and options trading carries substantial risk of loss and is not suitable for every investor.